
Why Shipping Lines Are Losing Billions on Full Ships
A container ship can sail completely full, every slot booked, and still lose its owner money. In February 2026, Maersk cut about a thousand corporate jobs after its ocean division's operating profit fell 71% through 2025, even as the cargo it carried grew. This video traces that swing back to the decisions that made it almost unavoidable.
It opens with Maersk's 2025-26 results (5 February 2026), then explains the multi-year lag between ordering a container ship and sailing it - a line has to guess demand three to five years ahead, with no cheap way to cancel. It goes back to 2021-22, the most profitable years in the industry's history ($150bn, then a forecast $223bn), when that cash paid for a record 548 ships ordered in 2021 alone, swelling the order book to 26-28% of the existing fleet by April 2022.
From late 2023, Houthi attacks forced carriers around the Cape of Good Hope instead of the Suez Canal, quietly absorbing the surplus for two years. An October 2025 Gaza ceasefire reversed that: by September 2026, Maersk alone was running 67 transits through Suez a month, against 8 the September before, releasing capacity back into the market just as a record wave of newbuild deliveries (2023-24) landed on top of it, pushing the forecast capacity surplus from 3-4% toward 14-15% in 2026.
It explains why spot rates - the price to book space today - collapse before contract customers' bills show the pain, and why carriers keep sailing ships at a loss rather than idling them. Drewry's 2 February 2026 forecast put the industry on course for a combined loss of up to $10bn in 2026, against a $20bn profit in 2025 - and the video sets that beside 2008-09 and the 2016 Hanjin Shipping bankruptcy ($5.4bn in debt, the world's seventh-largest line at the time) as the same pattern repeating.
It closes with the update the February forecast couldn't have: Maersk raised its own 2026 guidance twice over the following eight months, to $10.5-12.5bn in underlying cash profit, as demand and capacity discipline (scrapping, slow steaming, blank sailings) outperformed expectations. The order book built in 2021-22 was still running at 37-45% of the global fleet through 2026 regardless - discipline bought the industry a better year, not a different cycle.
Every figure is on screen with its source and date.
Tags
Chapters
- A record year, then red ink
- How a shipping line orders a ship
- 2021-22: the most profitable years in shipping history
- The ordering frenzy
- The Red Sea detour masks the problem
- 2025-26: the ceasefire reopens the shortcut
- New ships arrive on top of it
- Why rates collapse before losses show up
- The $10 billion year
- This has happened before
- Why the cycle keeps repeating
- What breaks the cycle, if anything
Video notes
1. A record year, then red ink
A container ship can sail completely full, every box sold, every slot booked — and still lose its owner money. That sounds like a contradiction. It is not. It is the ordinary state of the shipping industry right now.
Maersk's full-year 2025 revenue was fifty-four billion dollars, down from around fifty-five and a half billion the year before. Its ocean shipping division's operating profit fell seventy-one per cent over the same year, even though the volume of cargo it carried actually grew.
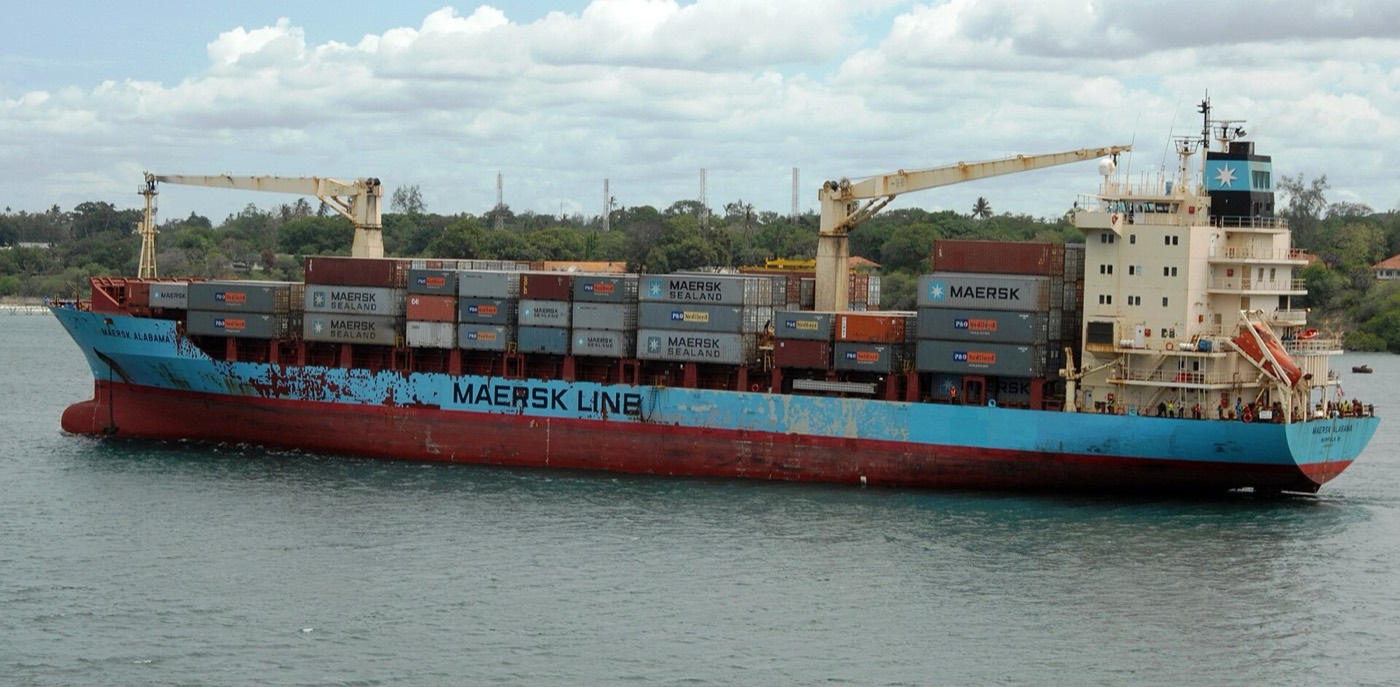
This is a real Maersk container ship, the MV Maersk Alabama. It belongs to the same ocean division whose profit collapsed through 2025, even while the company was carrying more cargo than the year before.
More cargo, less profit. That is the puzzle this video exists to solve.
In February 2026, Maersk announced it would cut about a thousand corporate jobs, roughly fifteen per cent of its office-based roles. The cuts were expected to save around a hundred and eighty million dollars a year. No seafarer or terminal jobs were affected, and the company's own guidance for 2026 pointed to a profit far below 2025's.
A thousand people lost their jobs at a company that was still moving record amounts of cargo. To understand why, this video has to go back five years, to the decisions that made this exact moment almost unavoidable.
2. How a shipping line orders a ship

A shipping line cannot simply buy a ship off a shelf. It has to order one, years before it will ever carry a single container.
A new container ship ordered from a shipyard typically takes three to five years to design, build and deliver. The shipping line pays a deposit when it signs the contract, and that deposit is mostly gone if the order is later cancelled.
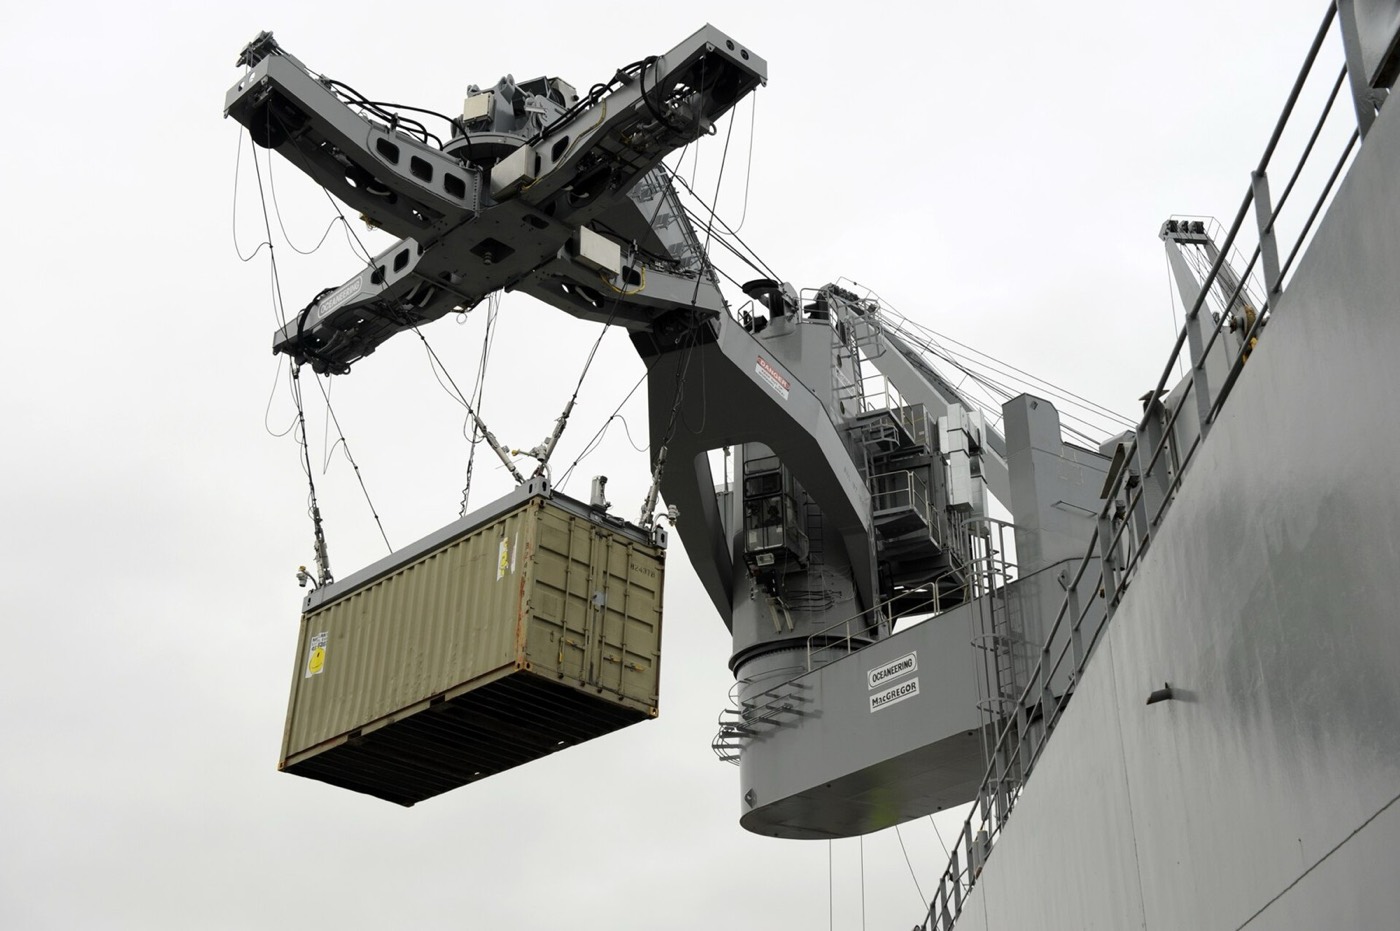
This is a container ship having cargo loaded aboard by crane — the ordinary, unglamorous business every one of these ordering decisions is ultimately about. Whatever a line orders today will not be carrying cargo like this for several years yet.
That gap between the decision and the delivery is the whole engine of this story. A shipping line has to guess what demand will look like three to five years from now, commit real money to that guess today, and then live with whichever guess turns out to be wrong.
In the industry's own language, a ship under contract but not yet delivered is called a "newbuild." The total of every newbuild on order across the industry, measured against the size of the fleet already sailing, is called the "order book." Both terms matter later in this video.
Most of the time, that guessing game works out reasonably well. Chapter three explains the one period when it did not — because the guess was too good.
3. 2021-22: the most profitable years in shipping history

Go back to 2020, and container shipping was a quiet, low-margin business that most people never thought about.
The industry made a record twenty-five point four billion dollars in profit in 2020. The following year, 2021, profit was forecast to reach a record one hundred and fifty billion dollars. By 2022, the forecast was higher again — around two hundred and twenty-three billion dollars.
Nobody in the industry had ever seen numbers like that, and the reason was simple: COVID-era demand for goods surged just as ports clogged up and ships queued for weeks to unload, so there were never enough empty containers in the right place at the right time.
A widely used benchmark, Drewry's World Container Index, peaked at about ten thousand dollars to ship a single forty-foot container in 2021 — against a pre-pandemic price of roughly one and a half to two thousand dollars.
A shipping line making that kind of money for the first time in its history does not sit on the cash. It spends it on ships. The next chapter is what that spending actually looked like.
4. The ordering frenzy

With more cash than container shipping had ever generated before, lines did the obvious thing: they placed orders, in numbers nobody had placed before.
A record five hundred and forty-eight container ships were ordered in 2021 alone, totalling about four point two million TEU of capacity. A TEU is a twenty-foot container — the standard unit the whole industry measures ship capacity in.
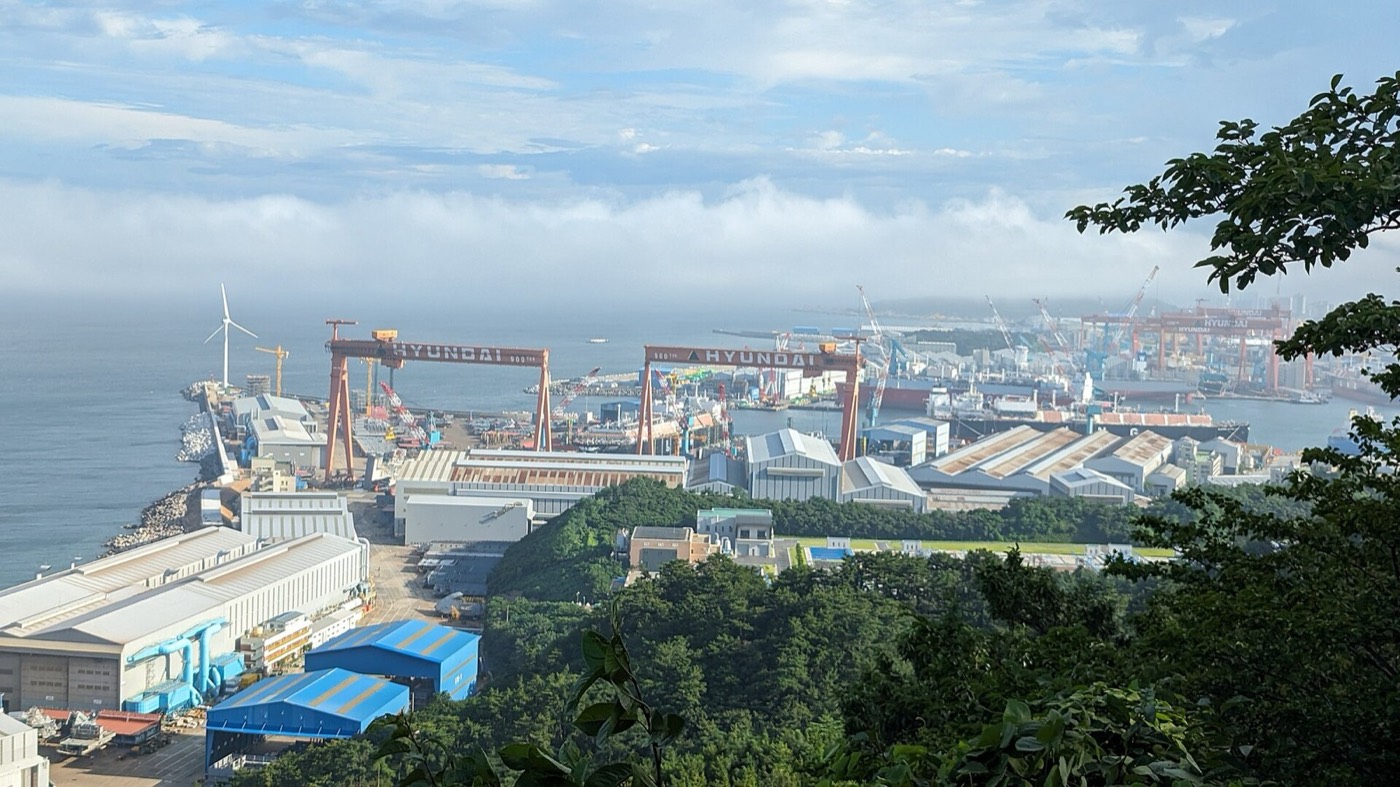
Most of those orders went to a small number of huge shipyards, concentrated in South Korea and China — including Hyundai Heavy Industries' yard at Ulsan, South Korea, pictured here.
This is that Ulsan shipyard. A single yard like this can be building dozens of these ships at once, each one locked in for delivery three to five years later, as chapter two explained.
By April 2022, the order book had swollen to about twenty-six to twenty- eight per cent of all the ships already sailing — every one of those newbuilds counted against the existing fleet. More than a quarter of the entire global fleet was sitting in shipyards, not yet built, committed to arrive on top of whatever the market looked like by then.
Nobody ordering those ships knew what that future market would look like. The next three chapters are what it actually turned into.
5. The Red Sea detour masks the problem


The first thing that happened to that future market was not demand falling. It was a war disguising the fact that it had.
From late 2023, Houthi forces based in Yemen began attacking commercial ships in the Red Sea, near the narrow Bab-el-Mandeb Strait at its southern end. Most container lines responded by diverting around the Cape of Good Hope, at the southern tip of Africa, instead of using the Suez Canal shortcut.
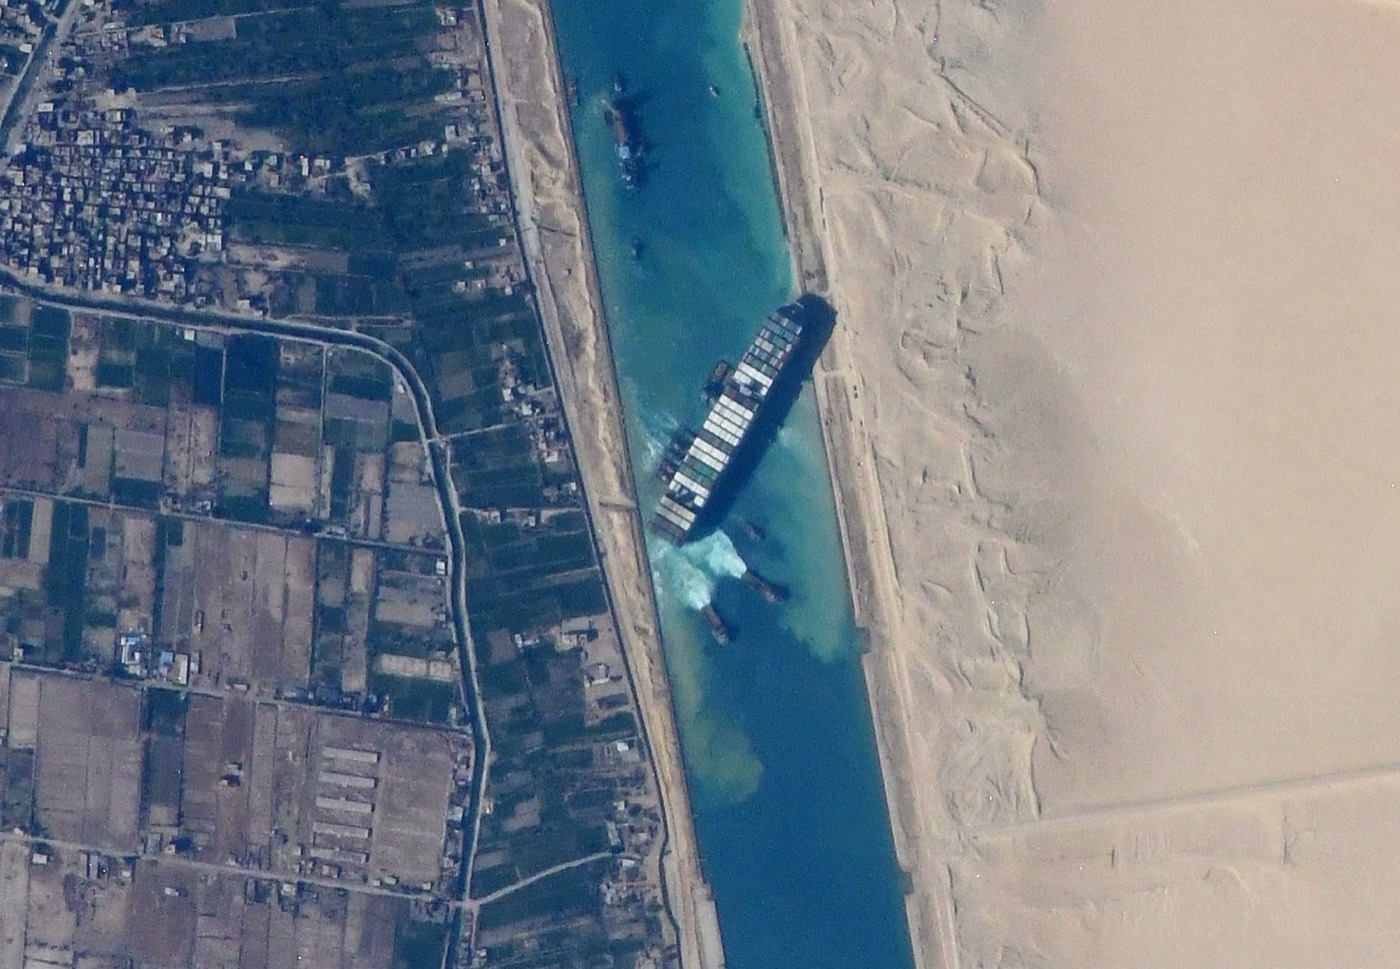
This is the Ever Given, a container ship that ran aground and blocked the Suez Canal for days in March 2021 — two years before the Houthi attacks began. It is shown here because it is the clearest picture of the canal itself: the shortcut that carriers spent the next three years avoiding.
The detour around Africa adds roughly ten to fourteen days to a typical Asia-Europe voyage. Sailing that much further is not free — it uses more fuel and more crew time, and it keeps the ship busy for longer per trip. But it has a side effect nobody intended.
Here is the strait itself, the Bab-el-Mandeb, viewed from orbit. Shipping people call a narrow strait like this a "chokepoint" — a point where a large share of world trade has no other route to take. It is the chokepoint that made carriers choose the long way round.
Every ship taking the long way is a ship that is busy for longer per voyage, which is functionally the same as the industry having fewer ships available. A longer voyage, for every ship avoiding the Red Sea, soaks up spare capacity without a single new vessel being built. For two years, that quietly absorbed a meaningful share of the surplus chapter four had just created. The next chapter is what happened when that absorption stopped.
6. 2025-26: the ceasefire reopens the shortcut
A ceasefire does not sound like shipping news. In this case, it was some of the most important shipping news of the year.
A Gaza ceasefire took effect in October 2025, easing the regional tension that had kept most carriers out of the Red Sea. The return was cautious at first: the Maersk Denver made one of the earliest test transits of the Bab-el-Mandeb Strait and Red Sea, on the eleventh and twelfth of January 2026.
Carriers did not rush back all at once. They tested the water, literally, for months.
By September 2026, the return had become real. Maersk alone put sixty-seven vessels through the Suez Canal that month, against just eight the September before. Monthly transits of large container ships rose sharply across the year, and by October almost every major carrier had made a tentative return to the Suez route.
Every ship that goes back to the Suez shortcut saves ten to fourteen days compared with the African detour chapter five described. Saving that time lets the same ship make more round trips in a year — which is, in effect, adding capacity to the fleet without ordering a single new vessel.
So the Red Sea return did two things at once: it cut costs for carriers happy to be back on the shorter route, and it put capacity back into a market that was about to receive a flood of new ships anyway. That collision is the next chapter.
7. New ships arrive on top of it
The timing could hardly have been worse, and nobody planned it that way — it is simply what a multi-year ordering lag does when two separate clocks run out at once.
Record numbers of newbuilds were delivered in exactly this window. Roughly two point three million TEU of new ship capacity arrived in 2023. About two point eight million TEU more arrived in 2024.
Those ships did not know or care that the Red Sea was about to reopen. They were built to a schedule set years earlier, in the ordering frenzy chapter four already described, and they arrived on it.
Analysts tracking the combined effect — new ships landing, and Red Sea capacity returning at the same time — estimated the industry's capacity surplus climbing from about three to four per cent of the fleet toward a forecast fourteen to fifteen per cent in 2026.
Shipping people have a term for this. A "capacity surplus" just means more ship space exists than there is cargo to fill it. A small surplus is healthy — it gives the industry room to grow into. A surplus this size is not room to grow into. It is empty space that somebody still has to pay to sail.
Three separate forces — the ordering frenzy, the reopened shortcut, and the new ships landing — all pointed the same way at once. The next chapter is what that collision does to prices.
8. Why rates collapse before losses show up

Too much ship space chasing too little cargo has a simple, brutal effect on price. It is worth being precise about which price.
Shipping has two kinds of price. A "spot rate" is the price to book space on a ship today, for one voyage. A "contract rate" is a price agreed months or a year in advance, usually higher and steadier. When a glut hits, the spot rate falls first and fastest, because it is the price nobody has locked in yet.
Spot container freight rates were forecast to fall by as much as twenty-five per cent year-on-year heading into 2026, even on routes where the Red Sea situation stayed calm. New ship deliveries were simply outrunning demand.
A falling spot rate does not immediately show up as a loss on anyone's accounts, because many of a carrier's customers are still paying the higher contract rate agreed months earlier. That is why the pain in chapter one's numbers took time to arrive.
And here is why carriers keep sailing nearly empty ships rather than parking them: an idle ship earns nothing at all, while even a loss-making sailing covers some of its fuel, port fees and crew costs. It also keeps the carrier's slot in its "alliance" — a group of carriers that share ships and sailing schedules on the same routes. Losing money slowly beats losing a customer, and a route, permanently.
Eventually, falling spot rates stop being a temporary headache and start showing up as a number the whole industry has to report. That number is next.
9. The $10 billion year

By early 2026, the gap between the earlier boom years' record profits and the glut described in the last three chapters had a name and a figure attached to it.
Drewry, a shipping consultancy, forecast on the second of February 2026 that the container shipping industry would make a combined loss of up to ten billion dollars in 2026. That would be a reversal from an estimated twenty billion dollars of combined profit across the industry in 2025.
The same forecast put the scale of the swing in one more number: industry-wide operating profit was expected to fall by ninety-six point seven per cent, year on year. Not a slowdown. Very close to zero.
That forecast, published in February, is the number most people who follow this story would quote today. It is also eight months old, and this video is not going to leave it there.
10. This has happened before

None of this — the boom, the frenzy, the glut, the losses — is new to shipping. It has happened at least twice before in living memory.
The 2008-09 financial crisis crashed cargo demand just as ships ordered during the previous boom were arriving — the same mismatch chapter seven described, playing out for an earlier generation of carriers.
In 2016, Hanjin Shipping was the world's seventh-largest container line, carrying about three per cent of global capacity. That year, it filed for court receivership in South Korea with about five point four billion dollars in debt, and it was formally declared bankrupt in February 2017.
Every time, the pattern is the same three steps: a boom convinces carriers to order ships, the ships arrive into a glut nobody ordering them could see coming, and the industry clears the excess through a bankruptcy, a merger, or both.
Hanjin did not survive its turn of the cycle. The question this video is building toward is whether this turn ends the same way, and if not, why not.
11. Why the cycle keeps repeating

If the pattern is this well known, a reasonable question is why nobody in the industry has simply stopped repeating it.
Chapter eight already introduced the "alliance" — a group of carriers sharing ships and schedules on the same routes rather than competing with separate fleets on every lane. That structure makes the ordering frenzy almost automatic.
When one line in an alliance orders a wave of new ships during a boom, its rivals tend to follow, because falling behind on fleet size or efficiency risks losing market share for a decade, not a year.
And chapter two's multi-year build lag guarantees that the decision and its consequences are separated by years. A line orders when the market looks a certain way. The ship arrives years later, into whatever the market looks like by then — and by then, every other line in the alliance ordered on the same optimistic logic, at the same time.
Bigger ships make each one cheaper to run, per container, which rewards ordering large even after a boom has clearly overshot. Nothing in that logic requires anyone to act irrationally. It only requires everyone to act rationally, on the same information, at the same time.
12. What breaks the cycle, if anything

So what, if anything, actually breaks this? Not by accident, this time — on purpose.
Carriers have three standard tools for managing a glut without reinventing the industry: scrapping the oldest, least efficient ships instead of sailing them; slow steaming, sailing more slowly to burn less fuel, which also makes each round trip take longer and quietly soaks up spare capacity; and blank sailings, cancelling a scheduled sailing outright to pull capacity off a route.
Those tools were already being used through 2026. And here is the update this video owes you, because the story did not stop in February.
Maersk raised its own 2026 profit guidance twice after that first forecast. By around June, its cash-profit guidance had risen to eight to ten billion dollars for the year. Later in the year it was raised again, to a range of ten and a half to twelve and a half billion dollars. Demand from Asia proved stronger than expected, and capacity discipline soaked up more of the glut than Drewry's February forecast assumed.
That sounds like good news, and for Maersk's 2026 accounts, it is. It is not the same as the cycle breaking.
The order book that chapter four described was ships ordered in 2021 and the year after. It was still running at somewhere between thirty-seven and forty-five per cent of the existing global fleet through 2026, by various industry estimates. Those ships are still arriving. Discipline and demand bought the industry a better year than it feared, and they did not make the ships already on order disappear.
So does bigger, more efficient capacity make global trade more resilient, or does the industry's own ordering cycle guarantee it keeps breaking itself? On the evidence of the earlier crashes this video has described, and this one, the honest answer is that efficiency and resilience are not the same thing. Every ship in this story is bigger, newer and more efficient than the one it replaced. None of that stopped the industry from ordering its way into the same trap a third time. The ships got better. The cycle did not.
Sources and credits
Photo credits (Wikimedia Commons)
- Ever Given container ship stuck in the Suez Canal, March 2021: NASA JSC ISS image library, Public domain - https://commons.wikimedia.org/wiki/File%3AEver_Given_in_Suez_Canal_viewed_from_ISS.jpg
- Bab-el-Mandeb Strait, satellite view (Red Sea chokepoint carriers diverted around): NASA/METI/AIST/Japan Space Systems, and U.S./Japan ASTER Science Team, Public domain - https://commons.wikimedia.org/wiki/File%3ABab-el-Mandeb_Strait%2C_Africa-Arabia_%28ASTER%29.jpg
- Hyundai Heavy Industries shipyard, Ulsan, South Korea - a major builder of the 2021-22 container ship orders: Wvdp, CC0 - https://commons.wikimedia.org/wiki/File%3AHyundai_Heavy_Industries_Ulsan_Shipyard_from_Jujeon_Beacon_Mound_-_2023-07-24.jpg
- Container ship (USNS Flickertail State) having containers loaded/unloaded by crane: U.S. Navy photo by John F. Williams, Public domain - https://commons.wikimedia.org/wiki/File%3AUS_Navy_091119-N-7676W-070_A_Large_Vessel_Interface_Lift-on-Lift-off_%28LVI_Lo-Lo%29_crane_demonstrates_container_transfers_aboard_USNS_Flickertail_State_%28T-ACS-5%29.jpg
- MV Maersk Alabama, a real Maersk container ship: Laura A. Moore, U.S. Navy, Public domain - https://commons.wikimedia.org/wiki/File%3AContainer_ship_MV_Maersk_Alabama.jpg
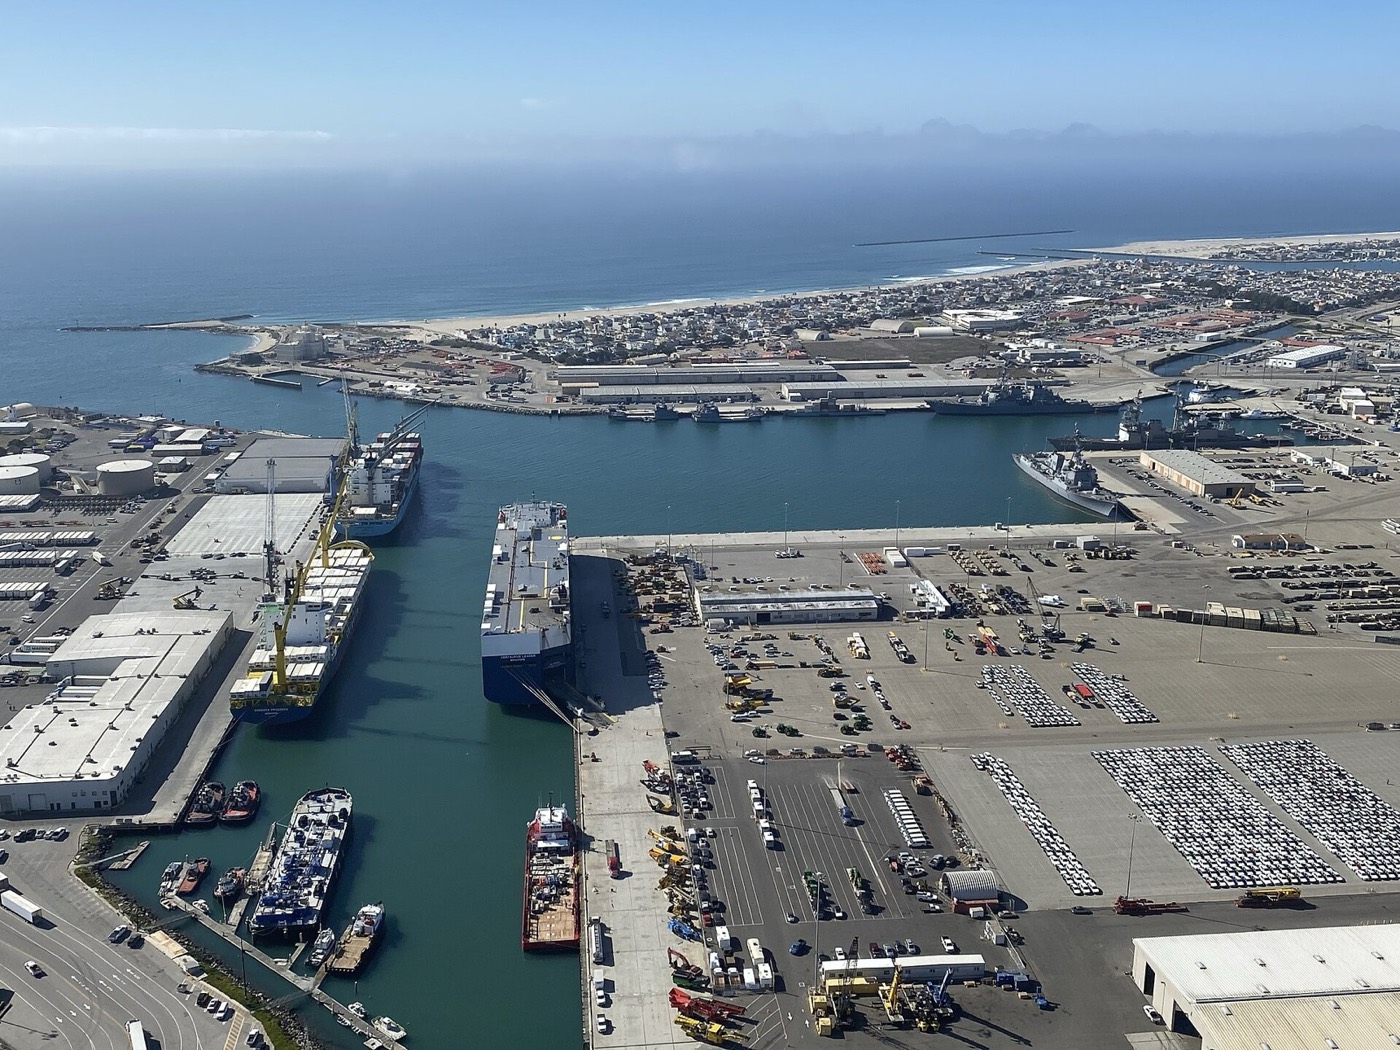
- Aerial view of a container port (Port Hueneme, California) with gantry cranes and stacked containers: U.S. Navy photo by Melinda Larson, Public domain - https://commons.wikimedia.org/wiki/File%3AAerial_view_of_Port_Huneme%2C_California_%28USA%29%2C_13_December_2020_%28200213-N-GO110-012%29.JPG


Primary sources
- A.P. Moller-Maersk, Q4 2025 and FY2025 financial results and initial 2026 guidance, announced 5 February 2026, reported by Maritime Gateway, ITLN and IndiaSeatradeNews - FY2025 revenue $54.0bn, Ocean division EBIT -71% to $1.4bn, Q4 2025 Ocean EBIT -$153m, the 1,000-job cut and $180m/year saving, and the initial $4.5-7bn 2026 EBITDA guidance.
- Seatrade Maritime, 'Record 4.2m teu in containerships ordered last year', citing Clarksons Research - the 548 ships / 4.2m TEU ordered in 2021.
- Maritime Executive, 'BIMCO: Containership Orderbook Hits Highest Mark Since 2008', 8 April 2022, citing BIMCO/Clarksons/Alphaliner - the order book at 26-28% of the existing global fleet by April 2022.
- Maritime Executive / Container News / Seatrade Maritime, 2021-22 reporting on Drewry's industry profit forecasts ($25.4bn 2020, $150bn 2021, $223bn 2022) and the World Container Index's 2021 peak of $10,377/FEU.
- Reuters / Lloyd's List, reporting on Houthi Red Sea attacks and the Cape of Good Hope diversion, December 2023 onward.
- Baird Maritime, 'Maersk navigates Red Sea route again as Gaza ceasefire holds' - the Maersk Denver's 11-12 January 2026 test transit; gCaptain, Lloyd's List Intelligence 'Red Sea Brief - 1 October 2026', Seatrade Maritime and TradLinx reporting on the September-October 2026 return (Maersk's 67 vs 8 transits; Suez transits up from 139 to 221 a month, March to September 2026).
- Hellenic Shipping News / FreightWaves, 'Tidal wave of new container ships: 2023-24 deliveries to break record', citing Clarksons - the ~2.3m TEU (2023) and ~2.8m TEU (2024) newbuild deliveries.
- Gulf News / breakbulk.news, 2026 reporting on container shipping overcapacity, citing analyst estimates for the 3-4%-to-14-15% capacity surplus forecast.
- gCaptain / FreightWaves / TheLoadstar, early-2026 reporting on spot container freight rates forecast to fall by as much as 25% year-on-year.
- Drewry Shipping Consultants, Financial Health-Check Report 2026, released 2 February 2026, reported by Gulf News and Hellenic Shipping News - the forecast combined 2026 industry loss of up to $10bn (vs ~$20bn profit in 2025) and the 96.7% forecast fall in industry EBIT.
- Seatrade Maritime, 'The end of Hanjin Shipping - officially declared bankrupt', and Supply Chain 24/7 - Hanjin's 31 August 2016 receivership filing with $5.4bn in debt, its 17 February 2017 bankruptcy declaration, and its status as the world's seventh-largest container line at the time.
- LogisticsViewpoints, 'Maersk's Raised Outlook Signals Freight Strength - But Not a Structural Reset', 30 June 2026, and Newsquawk/Datamar News coverage - Maersk's two subsequent 2026 guidance upgrades (to $8-10bn, then $10.5-12.5bn underlying EBITDA) and the continuing 37-45% order-book-to-fleet ratio through 2026.
Not regulated financial advice.