
Copper: The Metal the Electric Age Is Running Out Of
It follows copper from ore to cathode (open pit, crusher, concentrator, smelter and refinery, or the SX-EW route), explains why falling ore grades mean more rock for each tonne of metal, and shows where copper is dug and where it is refined: China holds about half of world refining capacity (IEA). It covers three mines going down within a year of each other — Grasberg in Indonesia, Kamoa-Kakula in Congo and Escondida in Chile — and why a new mine takes about 17 years to open (S&P Global).
Then the numbers: S&P Global expects demand of 42 million tonnes by 2040 and a gap of about 10 million tonnes; the IEA puts supply about 25% short of 2035 demand, down from about 30% a year earlier. Recycling, aluminium, US Section 232 tariffs and resource nationalism follow, and finally what could close the gap.
Every figure is on screen with its source and date.
In these topics
Chapters
Video notes
1. The metal inside everything
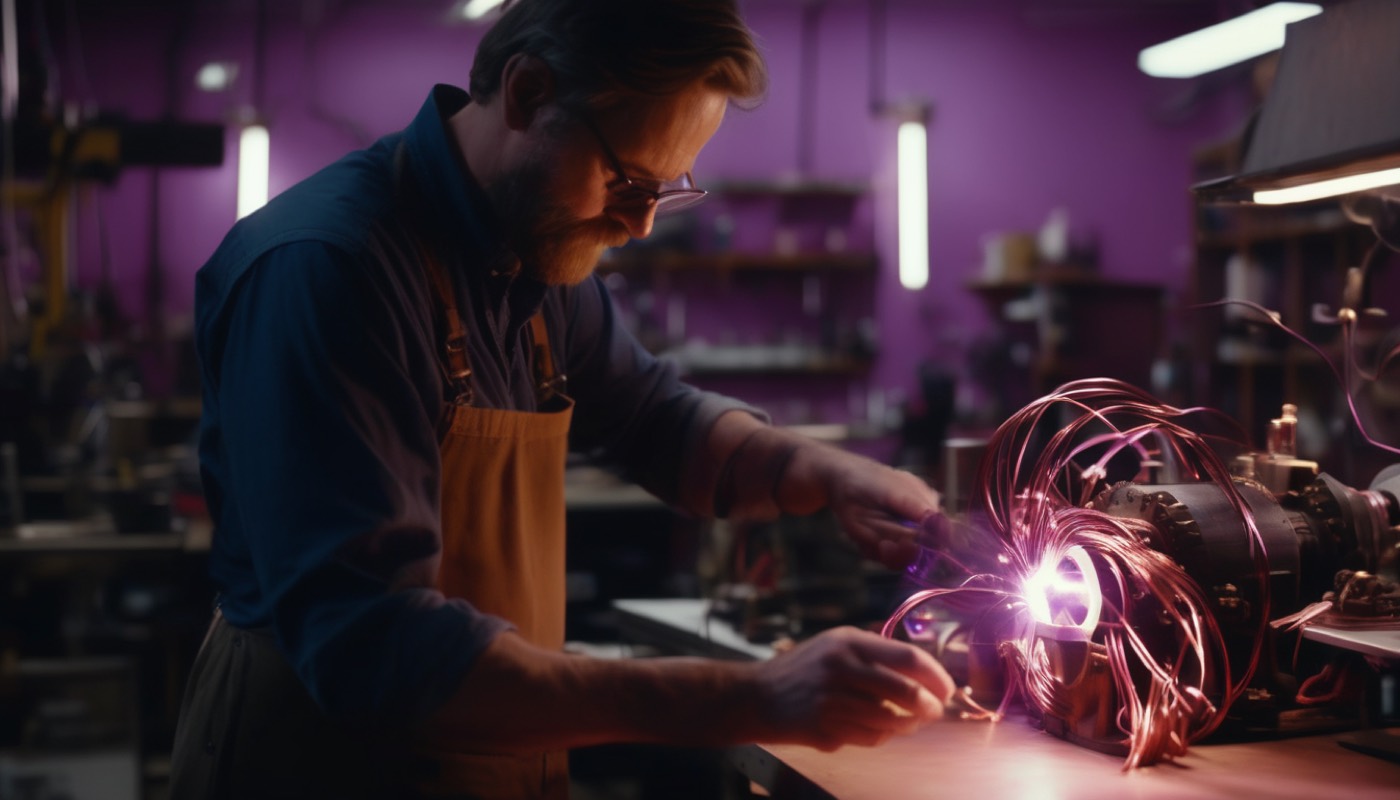
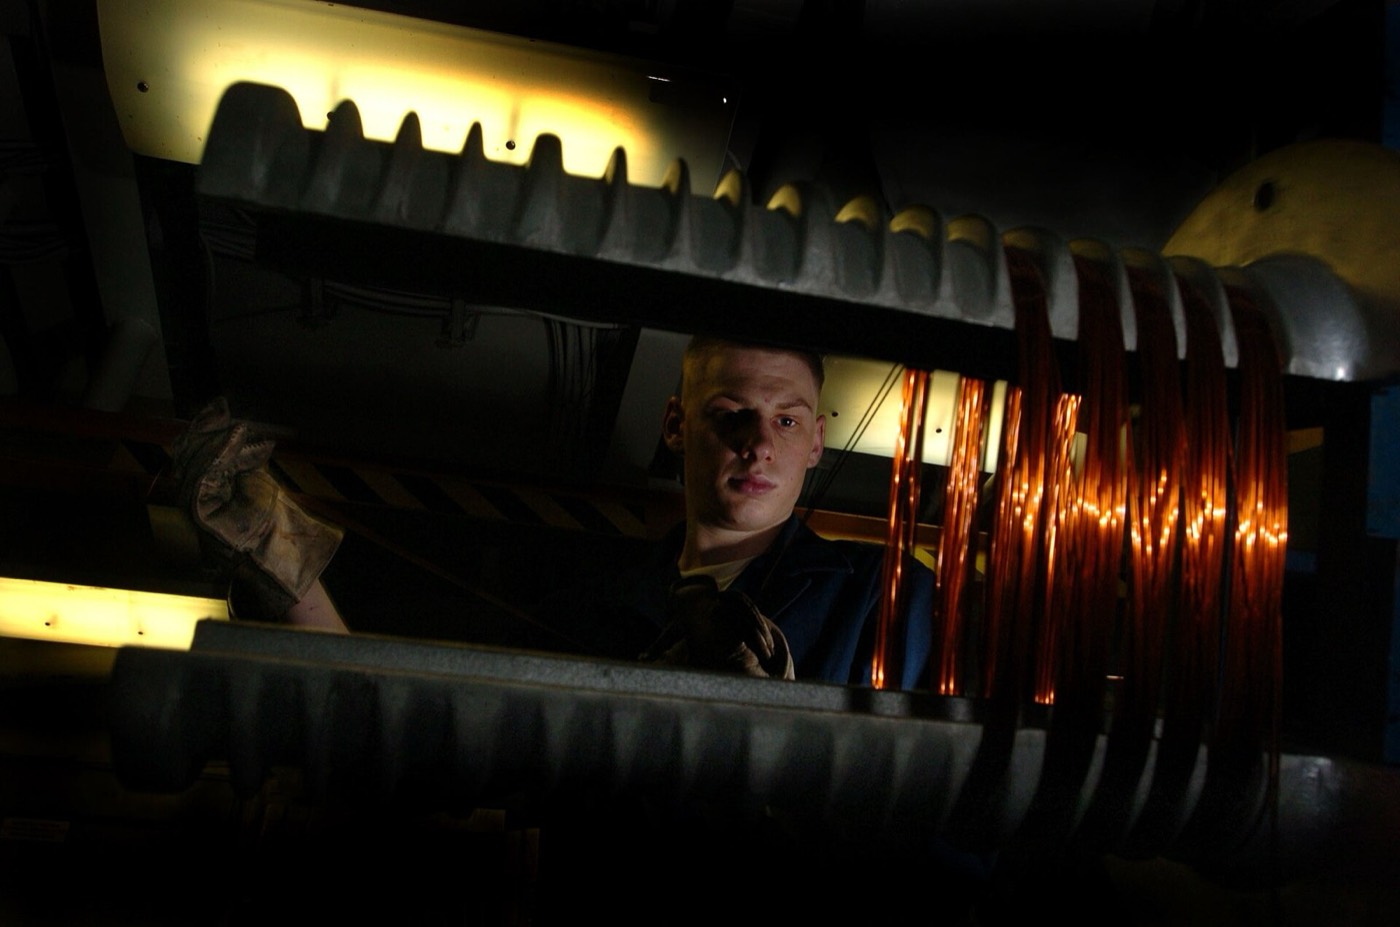
Look inside any electric machine, and you will find a reddish metal doing a quiet job. It carries the current. That metal is copper, and this video asks one question. Is the world going forwards to electrification faster than it can dig the metal to build it? Or does a shortage of copper hold the whole transition backwards?
Start with a motor. Inside an electric motor, copper wire is wound into tight coils. When current flows through a coil it becomes a magnet, and the push and pull between magnets turns the shaft. Every electric car, fan and washing machine has coils like these.
So why copper, and not something cheaper?
Why copper, and not something cheaper, is a question of conducting. Among the common metals, only silver carries electricity better, and silver costs far more. Copper also bends without cracking, so it can be drawn into thin wire. Aluminium is lighter and cheaper, but it carries less current for the same thickness.
Now follow the current back towards the power station. The network of lines and stations that carries it is called the grid.
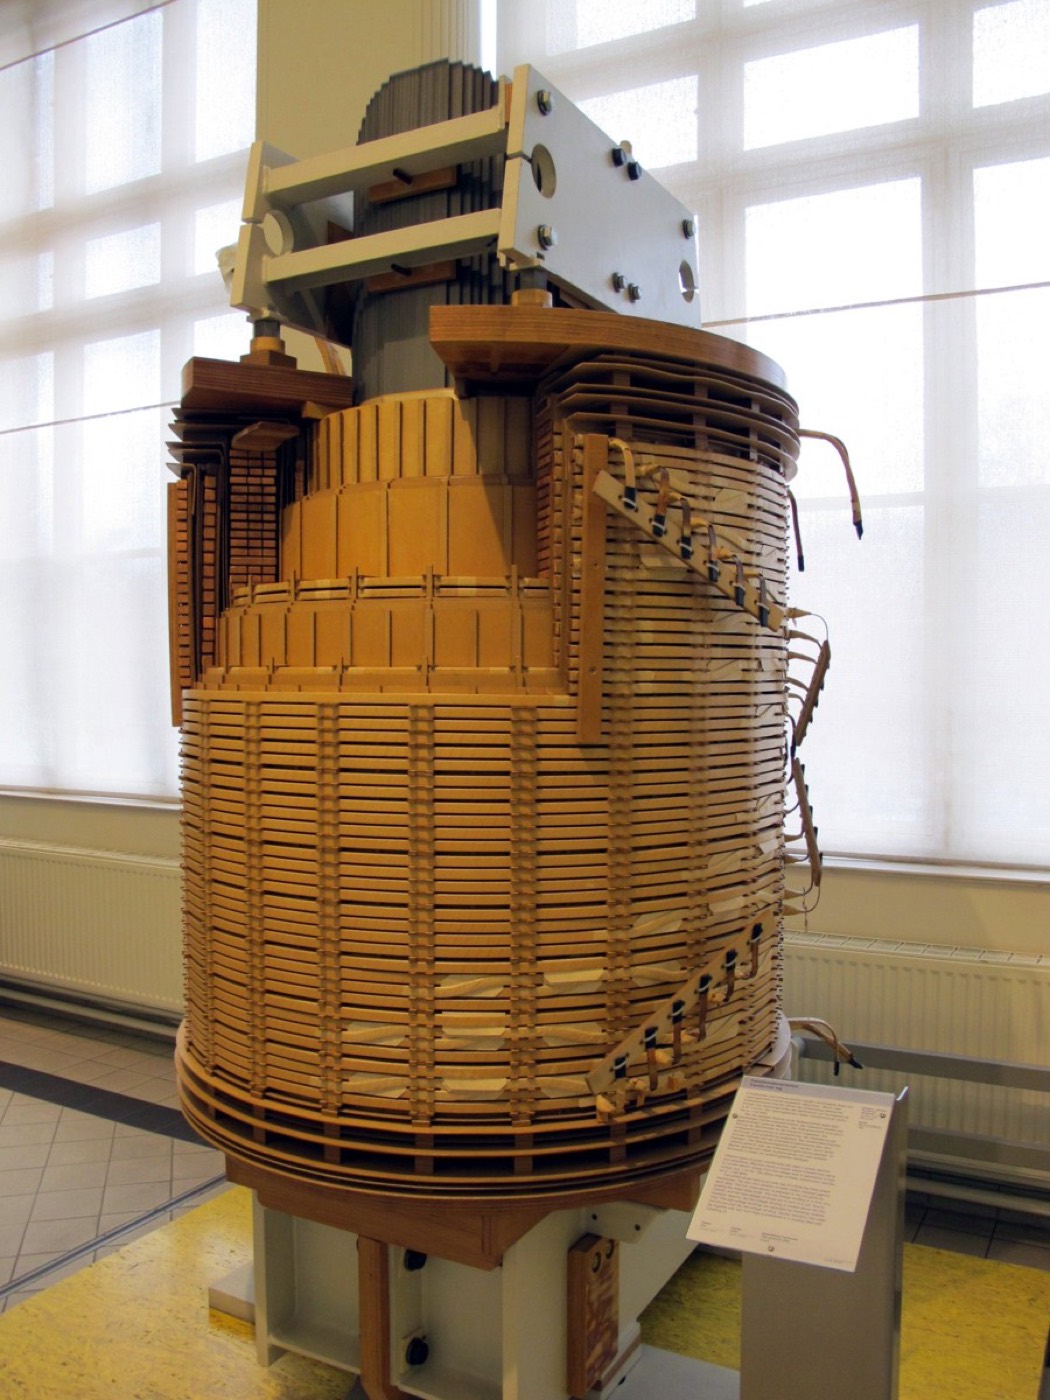
A transformer changes the voltage of electricity. Voltage is the push that drives the current. Power stations raise it for long journeys, and transformers lower it again before it reaches your home. Inside, coils of wire, usually copper, are wound around a core, and this one, on display, has been cut open to show the windings.
The grid leans on copper at every stage. Generators use copper windings to make the current. Substations use it to join their equipment together. Cables carry it into buildings and under city streets. Every new wind farm, solar park and charging point needs more of it.
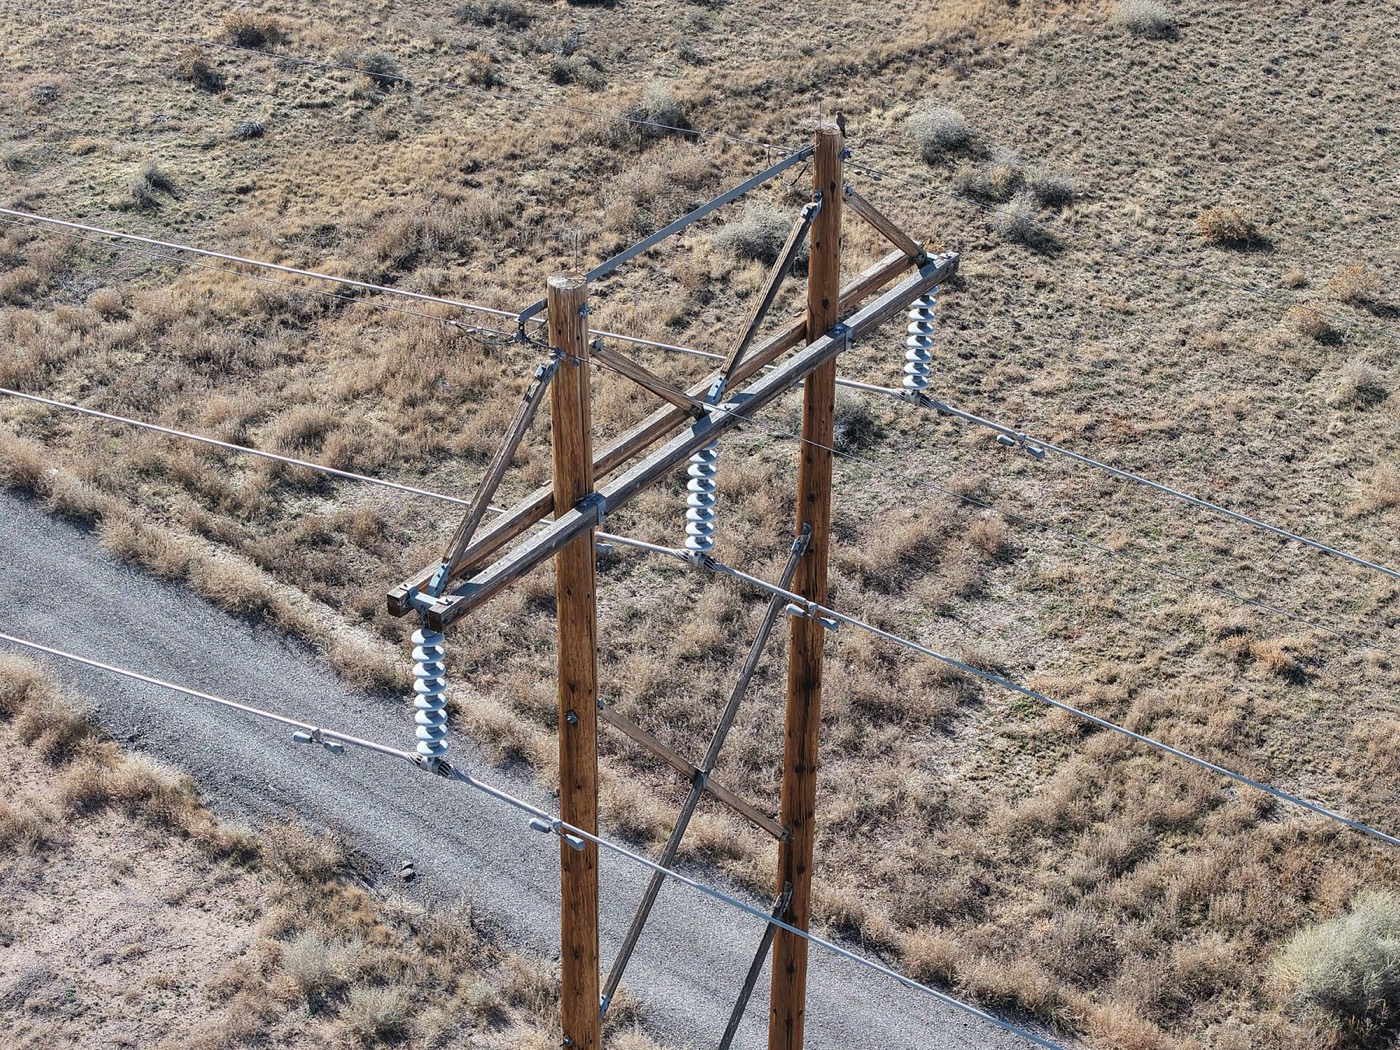
Long-distance overhead lines like this one often use aluminium. But copper fills the generators, the substations and the cables at each end of the line.
The newest customer is the data centre, a building full of computers. S&P Global, a market research firm, expects data-centre capacity to reach around five hundred and fifty gigawatts by twenty forty. A gigawatt is a billion watts, the output of a large power station. That is five times the level of twenty twenty-two.
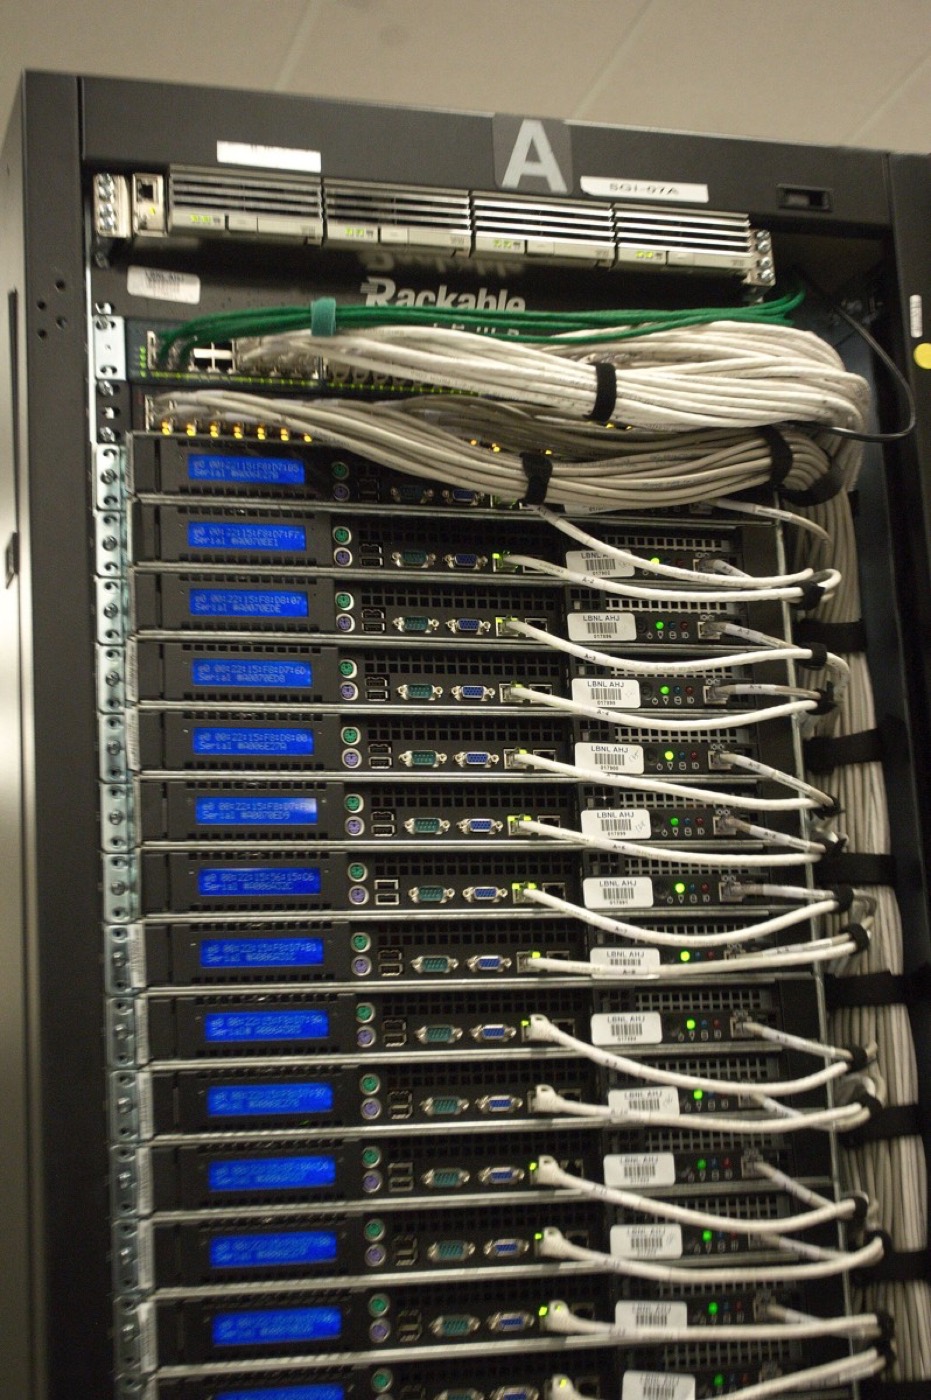
This is the back of a rack of computers in a research data centre. The thick bundles are power and data cables, and a large data centre holds many racks like this one.
So copper sits in the motor, the transformer, the line and the rack. Nothing else conducts as well at the price. And lately, that price has been making headlines.
2. A record price
Copper is bought and sold every day, and two markets set its price. Both of them broke records in September twenty twenty-six.
The London Metal Exchange, or LME, is one of the two main places where copper is priced. On the ninth of September, its benchmark three-month contract reached an all-time high of fourteen thousand eight hundred and fifty-eight dollars a tonne. That beat the previous day's record by about one hundred and fifty dollars.
The other market is COMEX, in New York, which quotes copper in dollars a pound. Its record came the same week, at six dollars eighty-nine cents. A tonne is roughly twenty-two hundred pounds. Converted to the same unit, that record works out at about fifteen thousand two hundred dollars a tonne, a few hundred dollars above London's record.
The two markets sit on opposite sides of the Atlantic. London is the older exchange, and New York is where American buyers trade. Prices in one soon pull the other, so a gap between them is a clue, and we will come back to it.
First, what does a record actually tell us?
A record price says that buyers are competing for scarce metal right now. It does not say what copper will cost next year. It does not prove that a shortage will last. And a price carries fear as well as facts, because traders buy ahead of what they expect to happen.
There were signs that the fear was real. In mid-August, Mining.com reported that copper in London warehouses had fallen for forty-two days in a row, to about two hundred thousand tonnes. The International Energy Agency put the wider picture in one line. Prices for copper, aluminium and tin, it said, rose by a third between January twenty twenty-five and April twenty twenty-six.
A high price is a signal. To understand what it signals, we need to see how the metal gets made.
3. From ore to cathode
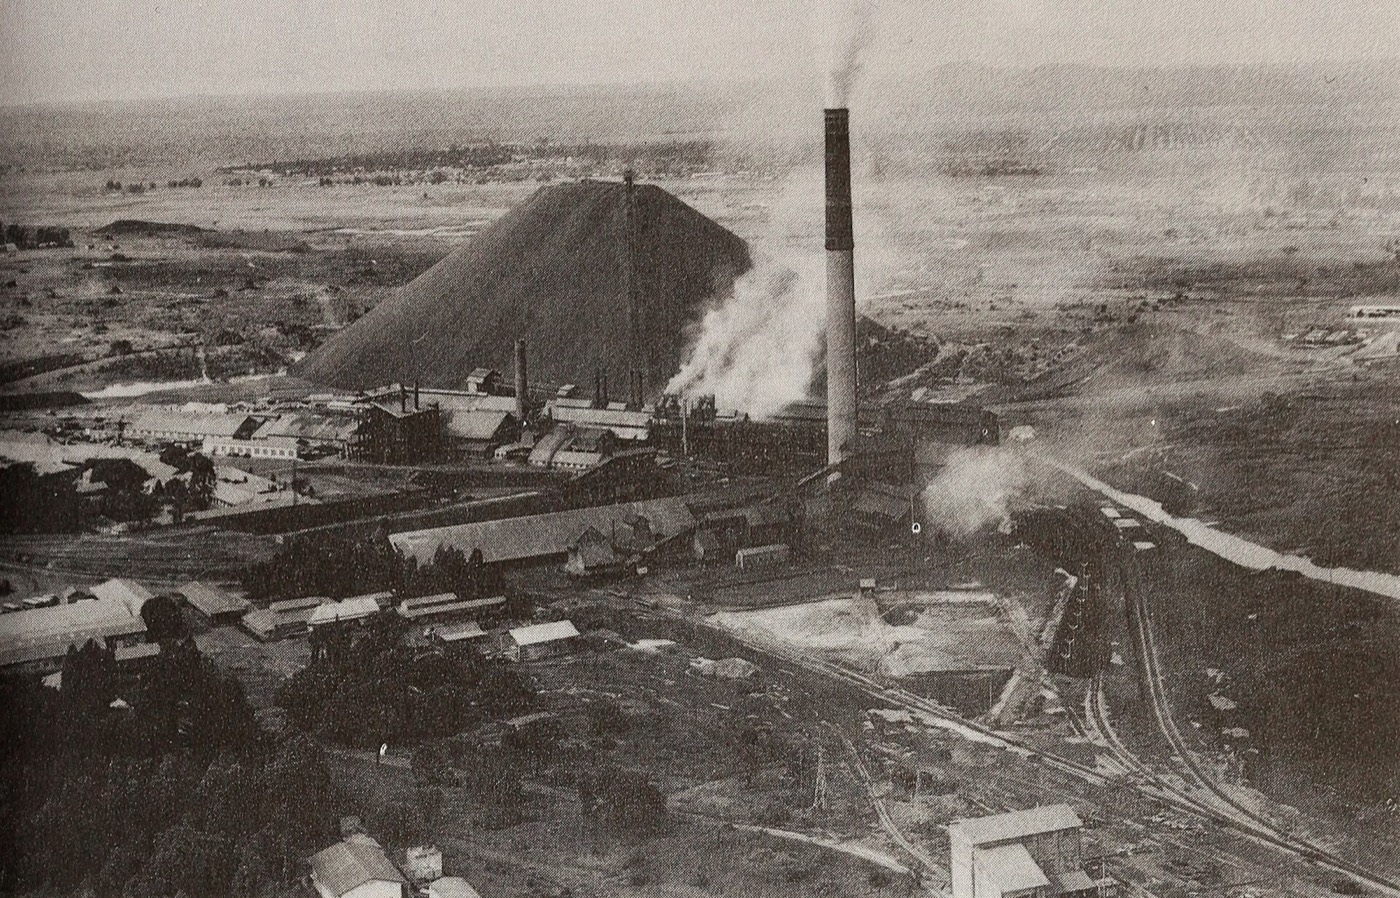
Copper does not come out of the ground as wire. It starts as rock, and the journey from rock to metal has many stages.
It starts with a hole in the ground. In an open pit, rock is blasted loose and trucked to a crusher, which breaks it into pieces. The pieces go to a concentrator, where they are ground to powder. Then a smelter melts the concentrate, and a refinery turns the melt into cathode, a sheet of nearly pure copper.
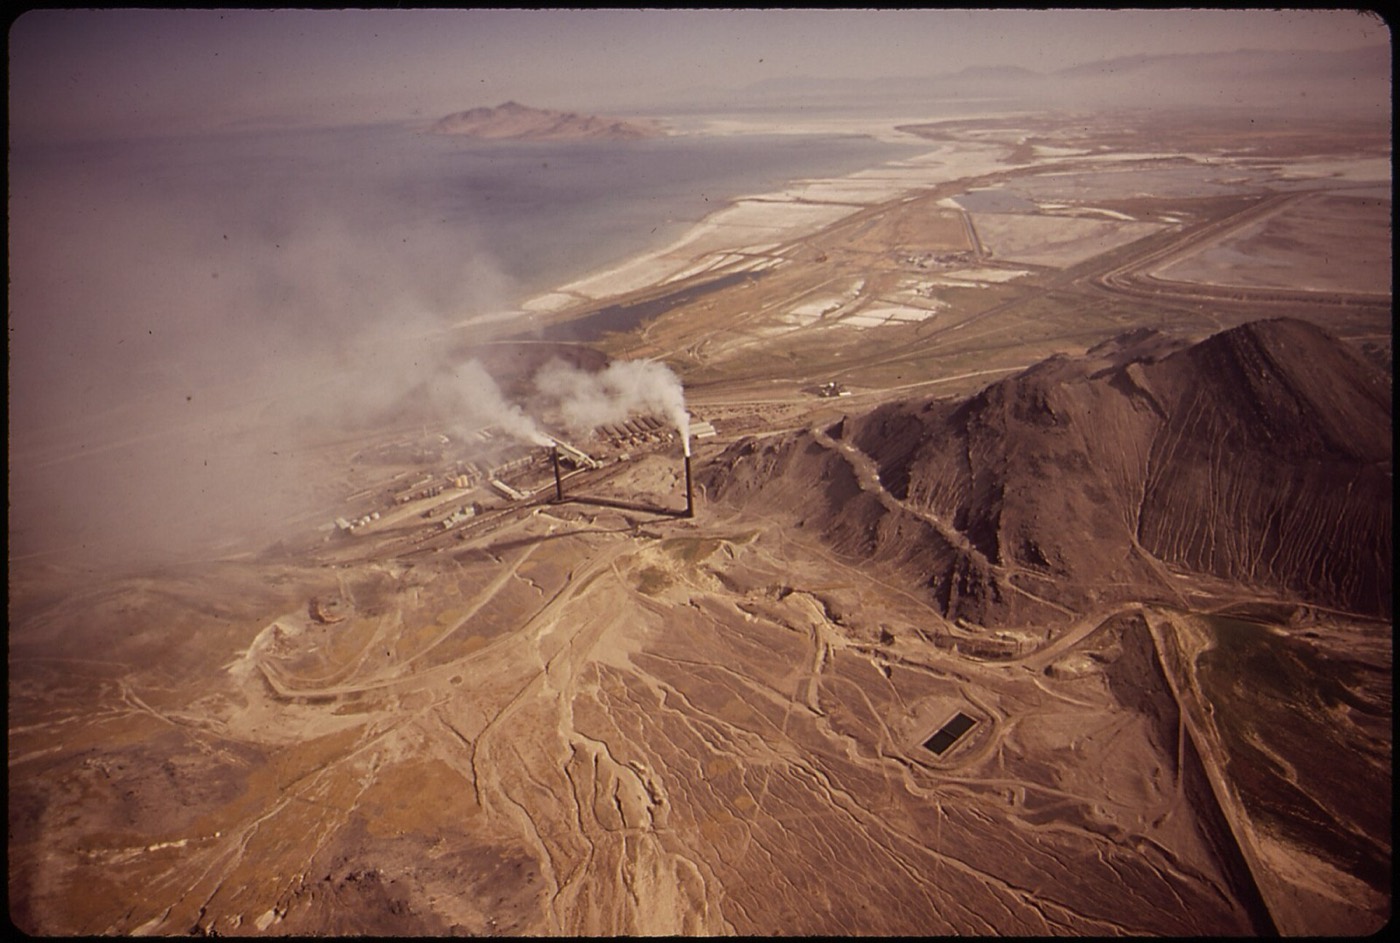
This is the Kennecott smelter and the Bingham mine in Utah, in one view. The pit on one side and the smelter on the other show how close together the first stages can be.
In the concentrator, the powder is mixed with water and chemicals. Bubbles are blown through the mixture. The copper minerals stick to the bubbles and float to the top, while the waste rock sinks. What is skimmed off is called concentrate, and it is much richer in copper than the rock it came from.
This is the Gécamines smelter at Lubumbashi, in the Democratic Republic of Congo. The smelter's furnace melts the concentrate, and the copper separates from the waste, which floats on top as slag.
Some ore does not need a smelter. Ore near the surface has often been weathered by air and water into a form that acids can dissolve.
For that ore, the route is called SX-EW. Sulphuric acid dissolves the copper out of crushed rock. Solvent extraction concentrates the liquid. Then electrowinning uses an electric current to pull the metal out of the liquid and onto a plate. It skips the smelter entirely.
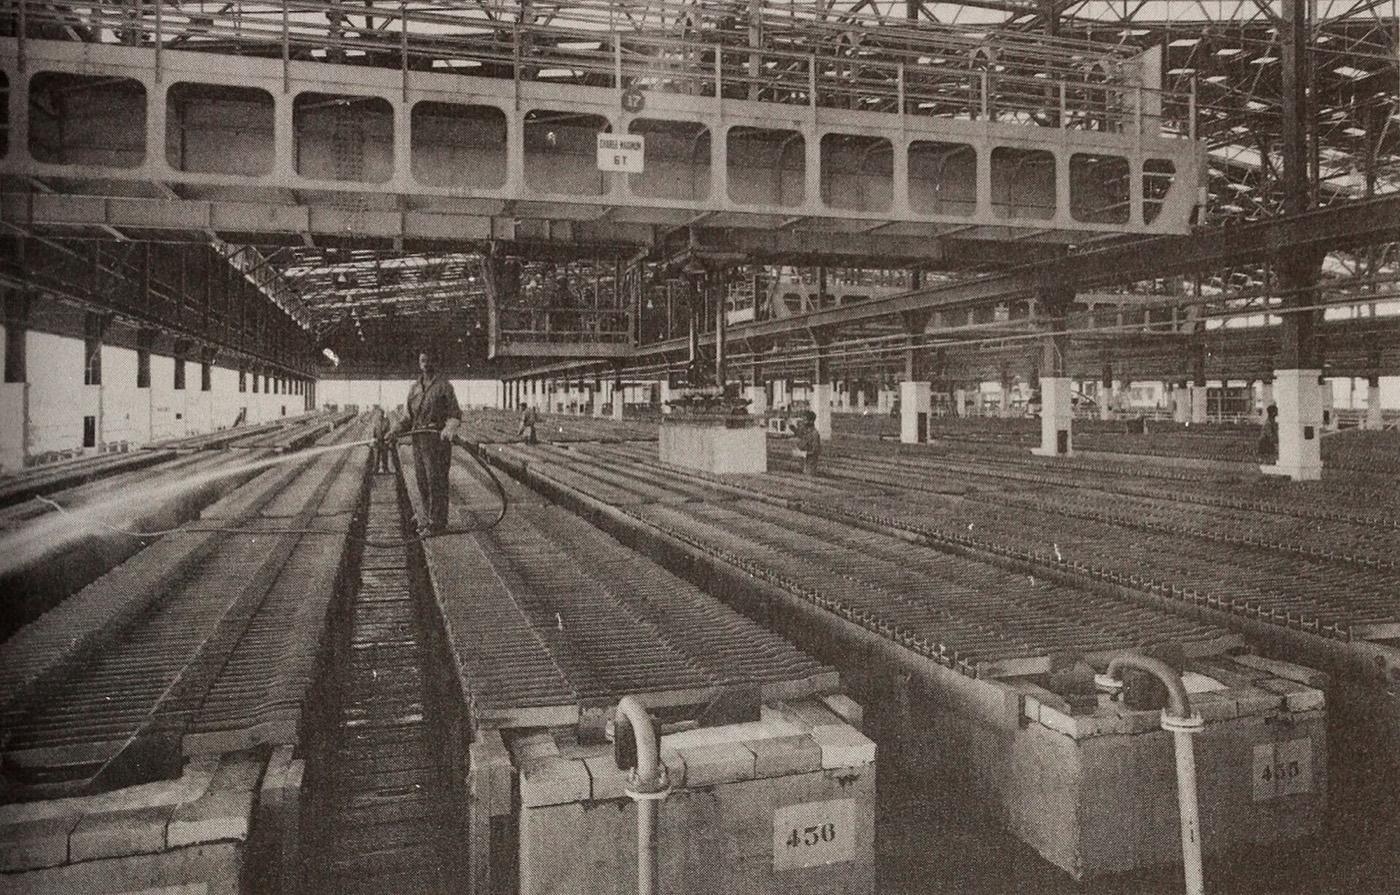
Either way, the last step is electricity.
This is the electrolysis room at the Gécamines Luilu refinery near Kolwezi. Copper plates hang in tanks of acid. A current passes through, and pure copper builds up on the cathode sheets.
Three places have appeared so far, and they show that the stages can be a long way apart.
Here they are on the map. Utah is in the United States. Lubumbashi and Kolwezi are both in the south of the Democratic Republic of Congo. Copper is often mined in one country, smelted in another and refined in a third, so the map of the metal is wider than the map of the mines.
The finished cathode is ninety-nine point nine nine per cent copper. Electrical wire needs metal that pure, because impurities get in the way of the current. So each stage exists to remove what is not copper.
4. Why ore is getting worse
Everything in that journey depends on one number.
That number is the grade. Grade is the share of the rock that is copper. A high grade means rich rock. A low grade means poor rock, where more must be dug for the same metal.
When the grade falls, a mine has to move more rock to get the same metal. Take a simple example. If the rock is one per cent copper, a hundred tonnes of rock gives one tonne of metal. If the grade halves, it takes two hundred tonnes. This is arithmetic, not a real mine.
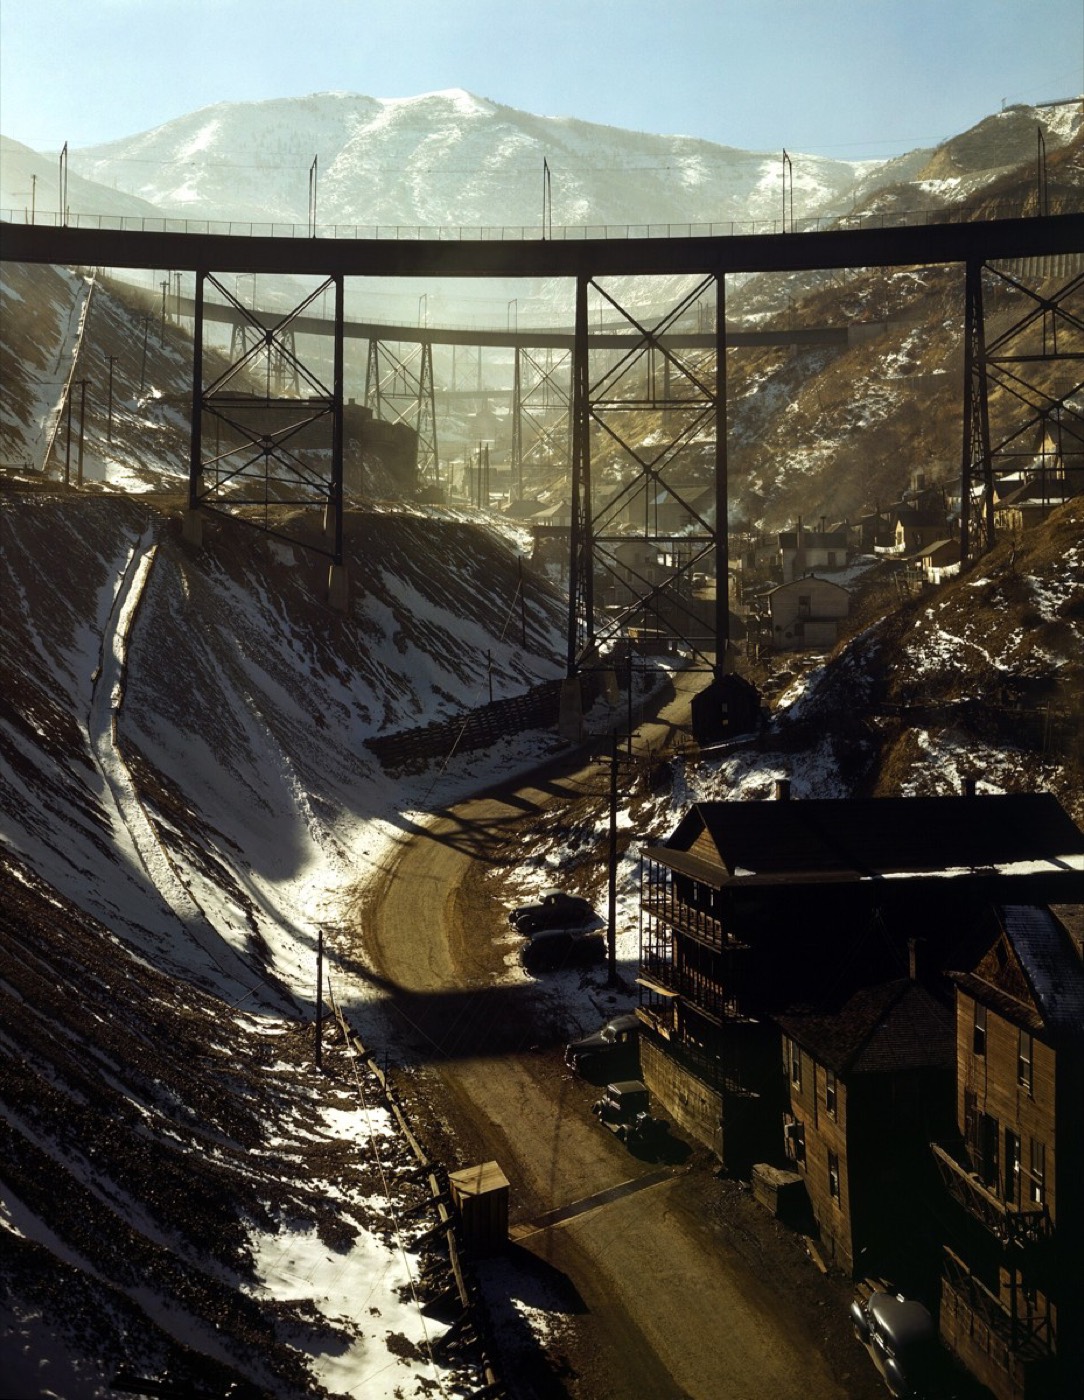
This is Bingham Canyon in Utah, photographed by Andreas Feininger during the Second World War. Miners tend to take the richest rock first. The easy, high-grade ore is dug early, and what is left is poorer.
Chile is the clearest example. It is the world's largest copper producer, and its national copper agency, Cochilco, publishes forecasts.
Here are the two places on the map. Bingham Canyon is in Utah, in the United States. Chile's great mines are in the north of the country, in the Atacama. The places are far apart, and the pattern is the same: the richest rock goes first.
In January, Cochilco forecast that Chile's output would peak at five point nine seven million tonnes in twenty twenty-seven. It expects a low of five point four three million in twenty thirty, then a recovery later in the next decade. The agency blames falling grades and the natural depletion of deposits.
Falling grades cost more in three ways. More rock means more diesel for the trucks. It means more electricity to grind the rock to powder. And it means more waste rock to store safely. So poorer ore does not just cost more to dig. It uses more energy, and energy is what an electric age is short of.
5. Where it is dug and refined
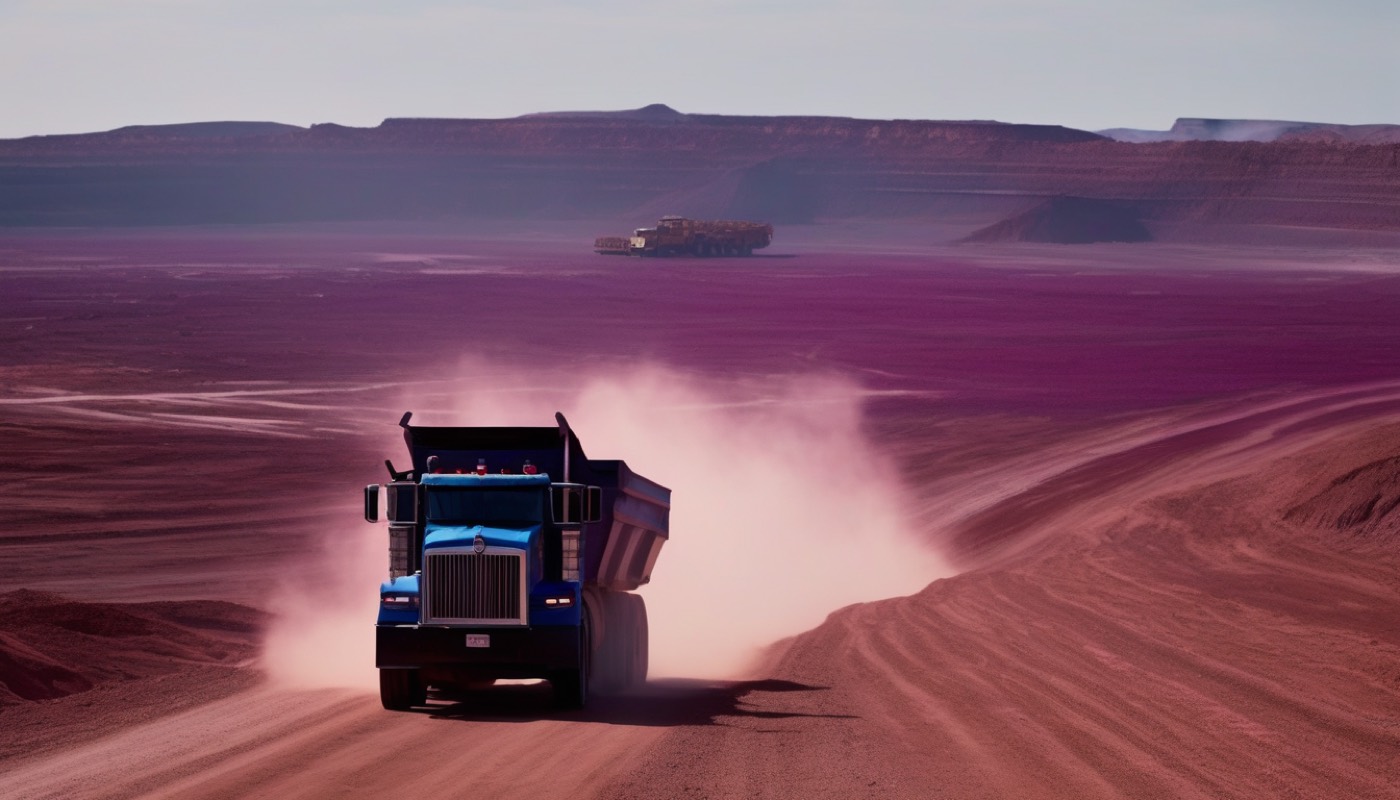
So where does the copper come from? Most of it comes from a short list of countries.
Chile, Peru, the Democratic Republic of Congo and Indonesia are the mining countries in this story. China is the biggest refiner. Copper is mined mostly in the Andes, in Central Africa and in the islands of Southeast Asia, but refined mostly in China.
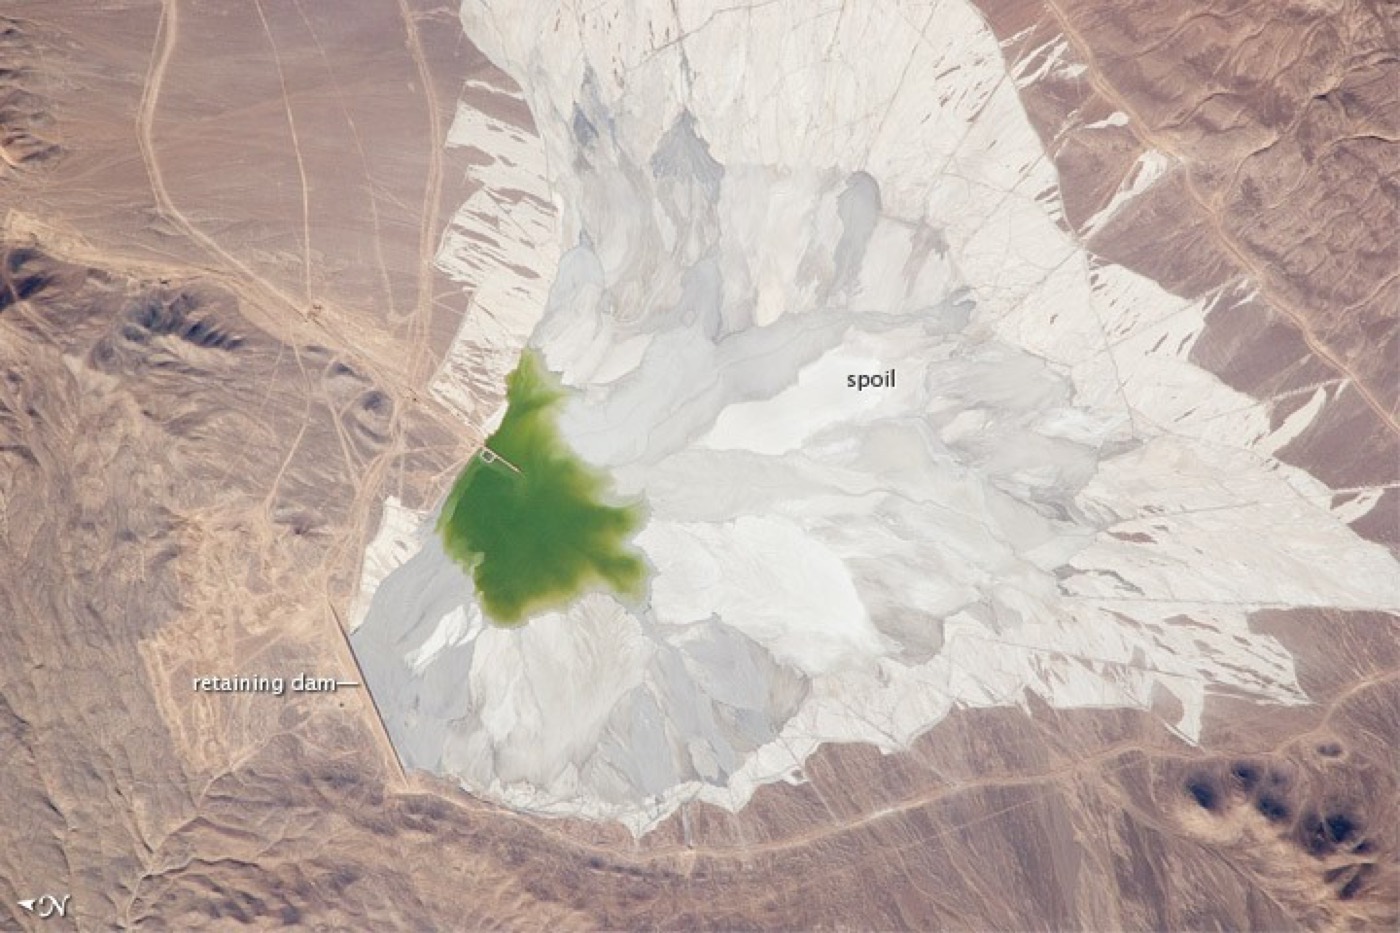
This is the Escondida mine in the Atacama Desert in Chile, photographed by astronauts on the International Space Station. The Atacama is one of the driest places on Earth, and the pit is large enough to see from space.
In Africa, the story is one of fast growth. The Democratic Republic of Congo has become a major producer in a short time.
The rock of Kolwezi, in southern Congo, is rich in copper. Congo is also building processing at home. Ivanhoe Mines said its Kamoa-Kakula smelter began operating on the first of December, twenty twenty-five.
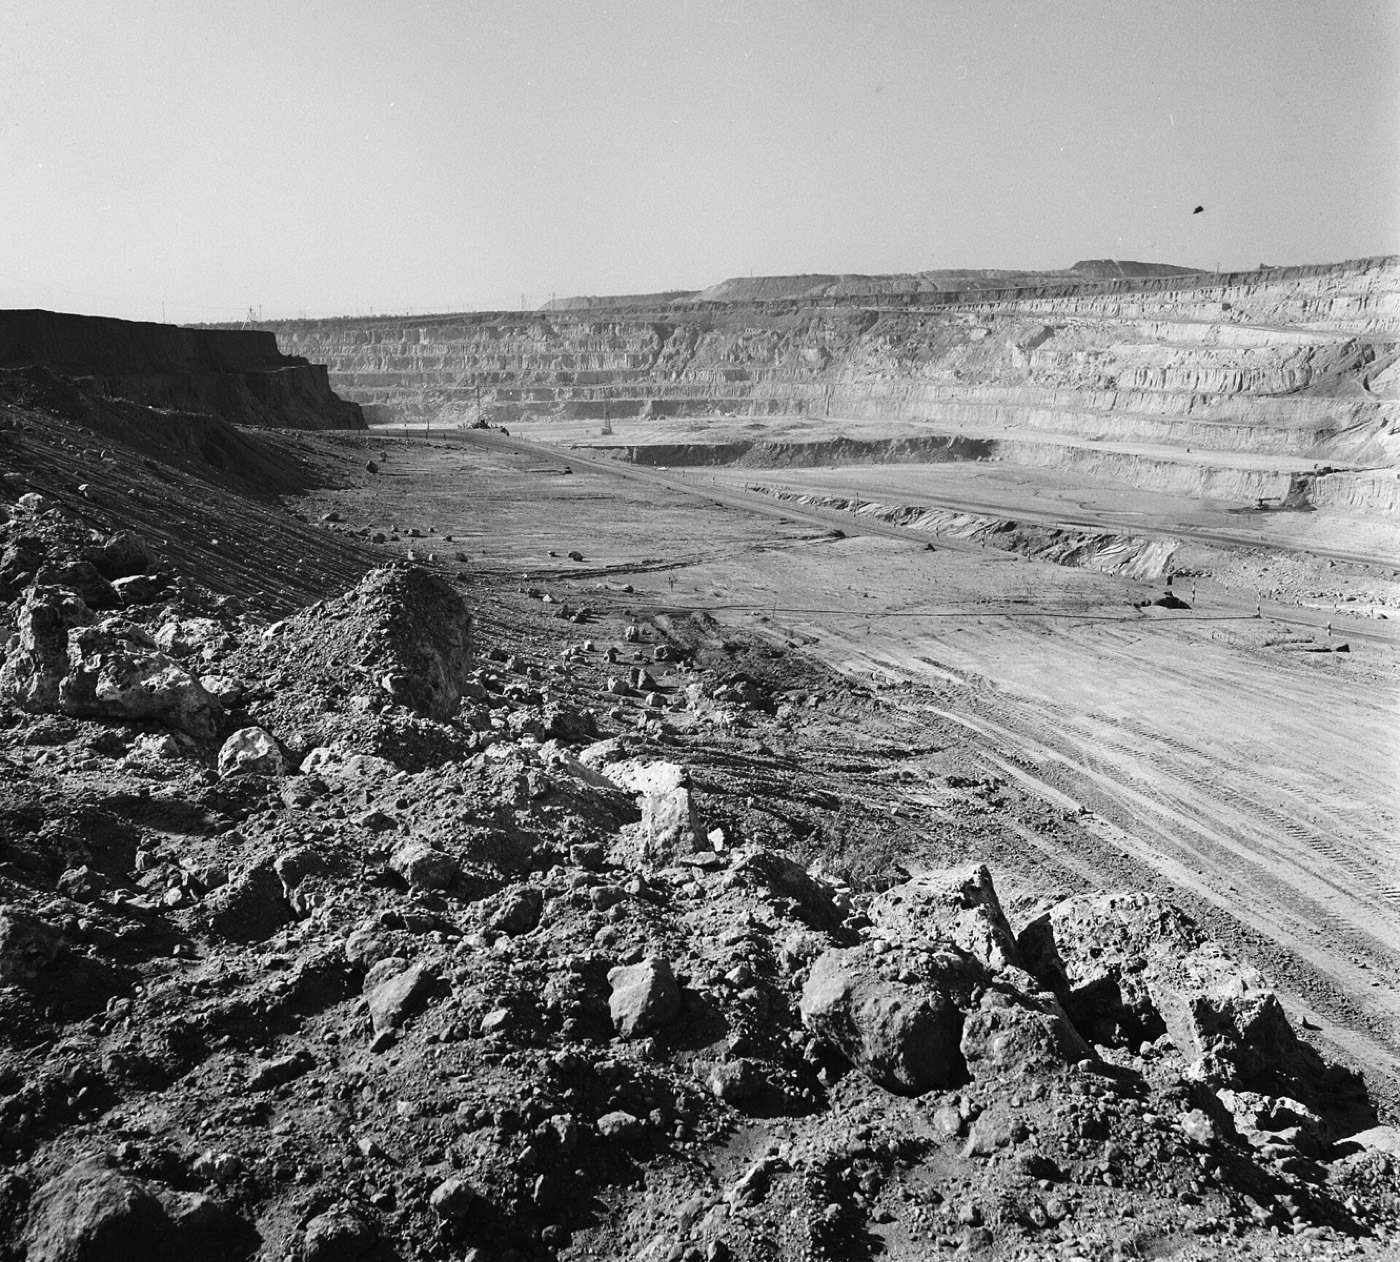
This is an archive photograph of a copper mine at Kolwezi. The pale bands on the far wall are the benches, the steps cut into the hillside as the pit goes deeper.
The others complete the picture.
Peru is another large producer. Indonesia is home to Grasberg, one of the largest mines in the world, high in the mountains of Papua. We will meet it again in the next chapter.
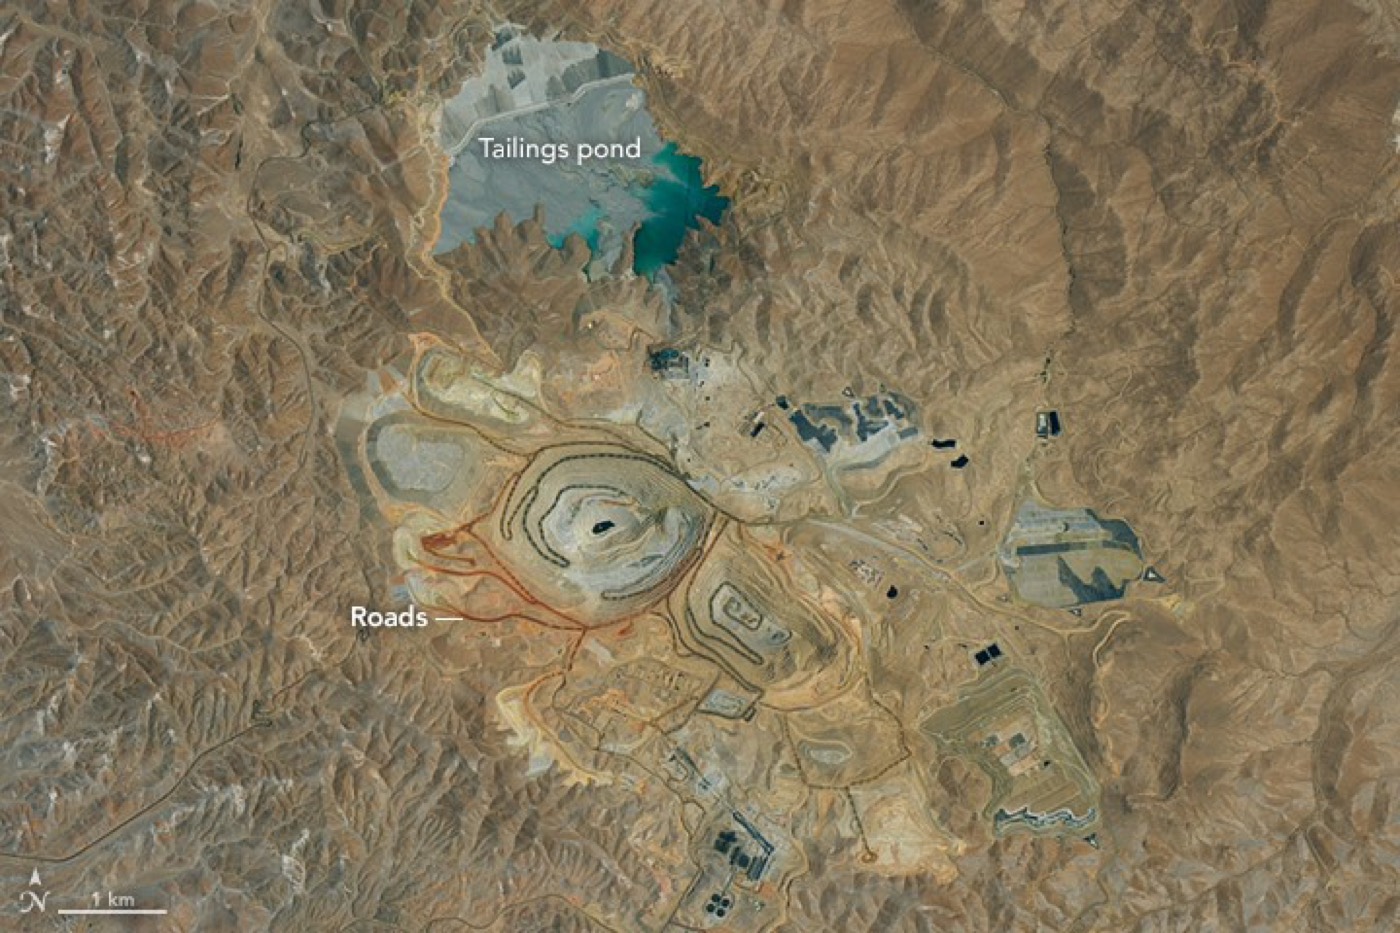
This is Cerro Verde in Peru, seen from a NASA satellite. The labelled pond holds tailings, the waste left over after the copper has been floated off, and the roads link the pits to the plant.
Mining is only half of it. The other half is refining, and there the picture narrows.
According to the International Energy Agency, China holds about half of the world's copper refining capacity. That means most of the world's mined copper, wherever it is dug, has to pass through Chinese plants to become metal that manufacturers can use. It is a chokepoint, and it matters when supply is tight.
6. Three mines down at once
A tight market can absorb a lot, but it cannot absorb three of its largest mines going down together. In the last two years, that is close to what happened.
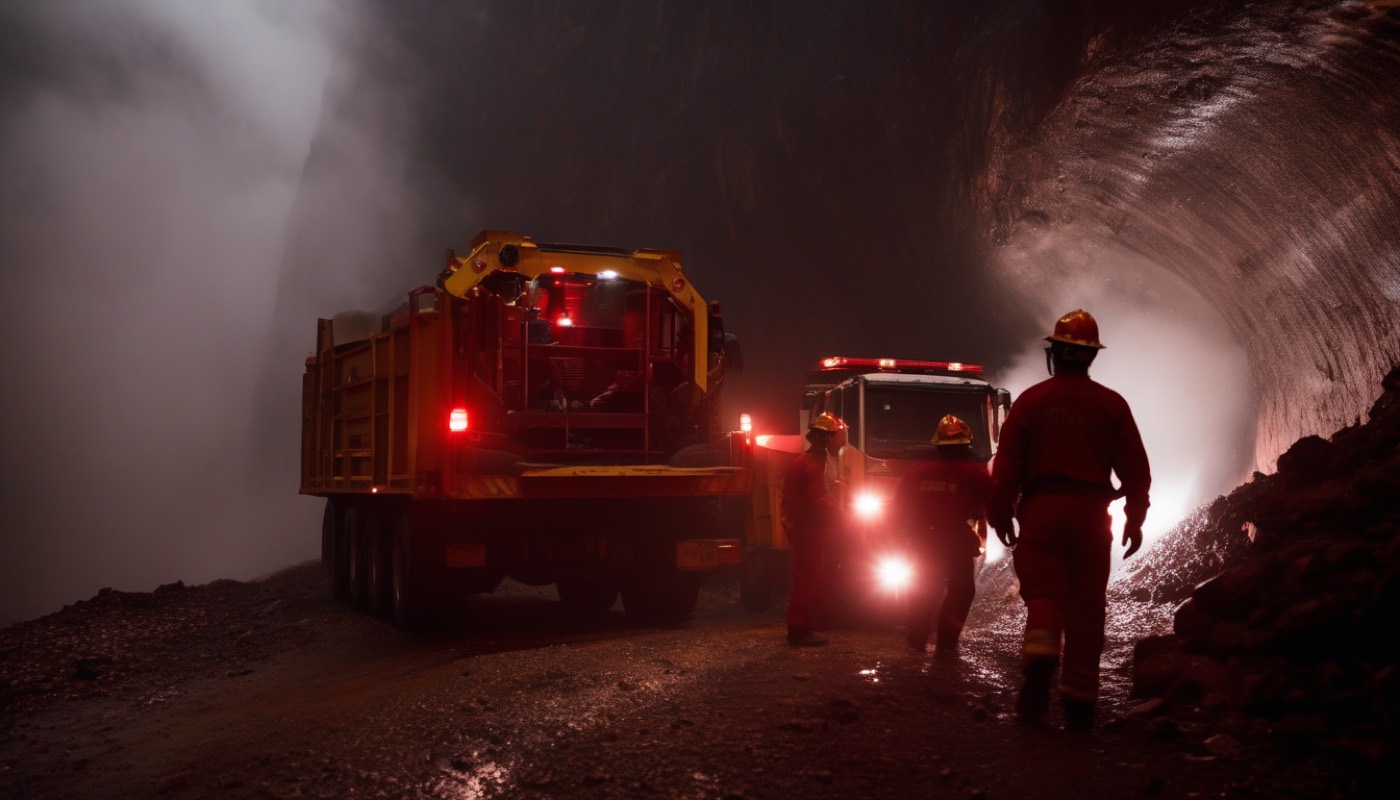
Three mines, on three continents, went down in turn. In May twenty twenty-five, seismic activity flooded part of the Kakula mine in Congo. In September twenty twenty-five, a mud rush at Grasberg in Indonesia shut the underground mine. And in September twenty twenty-six, a fatal accident closed Escondida, the world's largest copper mine, in Chile. The timeline shows how the recovery is spread out into twenty twenty-seven.
Start with Grasberg.
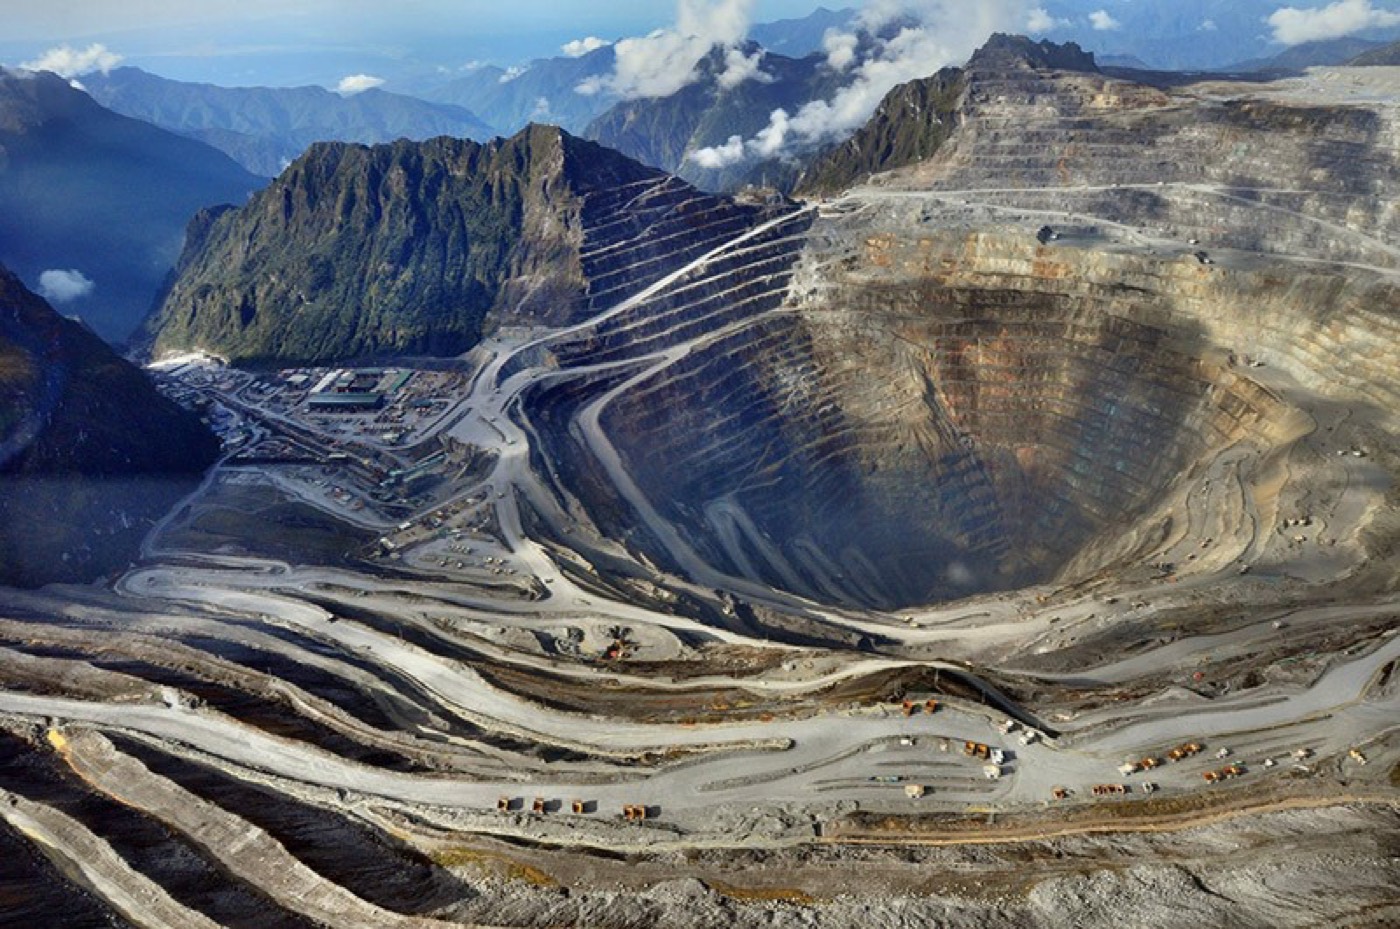
This is the Grasberg mine in Papua, Indonesia, photographed by the country's energy ministry. Its underground mine is a block cave, a method where rock is undermined and falls under its own weight into chutes below. A mud rush is a sudden flow of wet rock and mud, and it tore into that mine.
The owner, Freeport-McMoRan, restarted the mine in stages. It says it expects to sell about three point one billion pounds of copper in twenty twenty-six. In January it had expected about three point four billion. Freeport also says the mine will reach full capacity only by the end of twenty twenty-seven.
Now Congo.
Here are the three mines on the map. Kamoa-Kakula is in southern Congo, Grasberg is in Papua, and Escondida is in the north of Chile. Three shocks, on three continents, in a single market.
At Kamoa-Kakula, Ivanhoe Mines redesigned the mine after the seismic event of May twenty twenty-five. In April it cut its guidance for twenty twenty-six to between two hundred and ninety thousand and three hundred and thirty thousand tonnes. In December it had said between three hundred and eighty thousand and four hundred and twenty thousand.
Then, in September twenty twenty-six, the third mine went down.
At Escondida, a contractor died in an accident involving a front-end loader on the twenty-third of September. BHP, the mine's owner, suspended all operations while Chile's mining regulator investigated, with no restart date given in the sources checked for this video. By the end of that month, BHP said it was progressively resuming operations under the regulator's clearance.
So how do these mine problems cut refined output?
Every tonne of copper lost at a mine is a tonne of concentrate that a smelter does not receive. Smelters run below capacity, and less refined metal comes out at the end. Mining.com reported in August that smelters in China were cutting output on tight supplies of concentrate. The shock at the pit travels all the way to the cathode.
7. Why a mine takes 17 years
If copper is short, why not just open more mines? Because opening a mine takes far longer than most people expect.
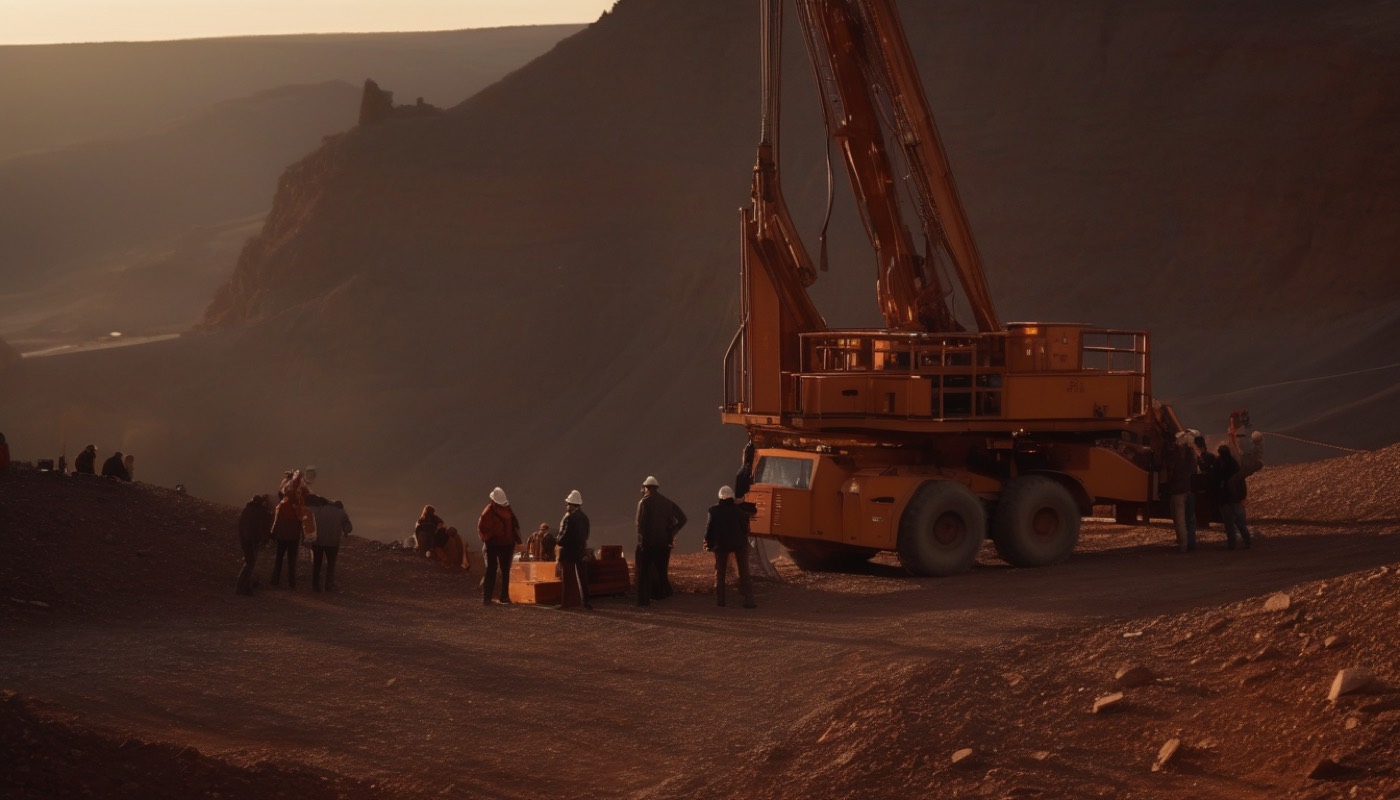
S&P Global puts the average at seventeen years, from discovery to first production. The stages are discovery, drilling, studies, permits, finance and construction. None of them can easily be skipped, and each has to be finished before the next can start.
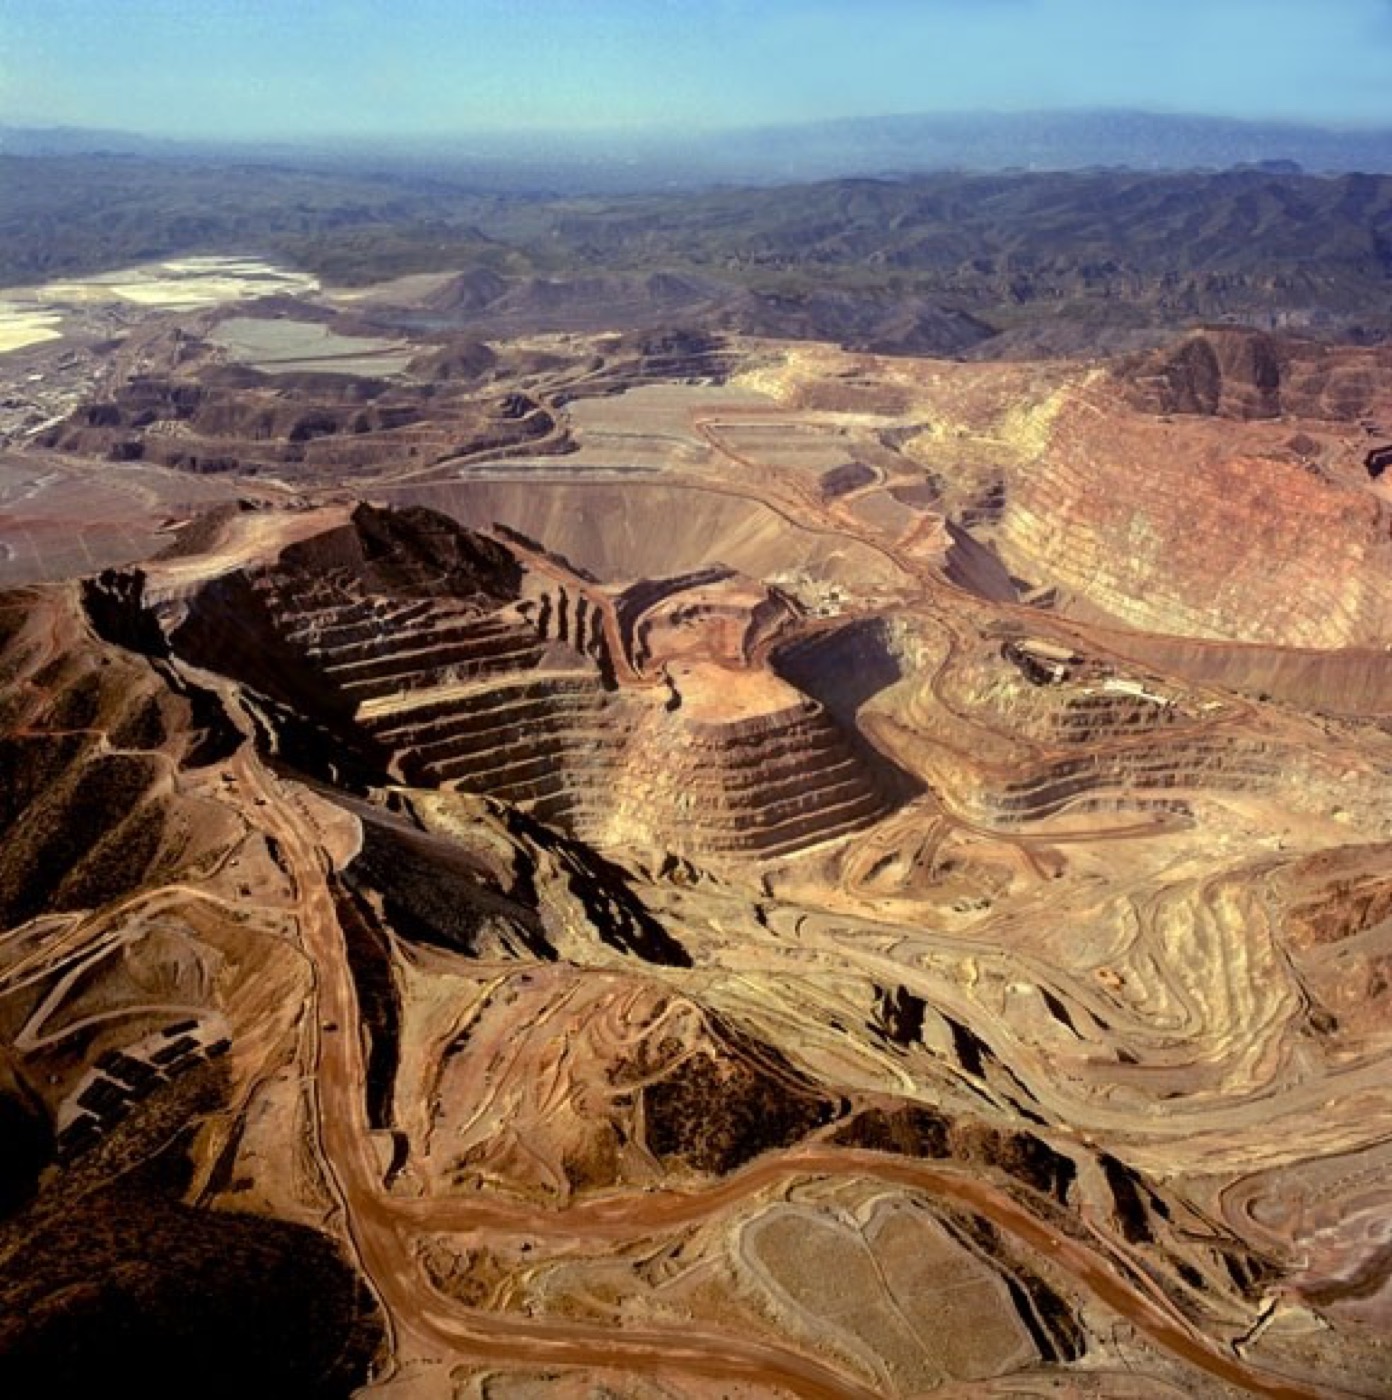
This is the Morenci mine, one of the big open-pit copper mines. Every pit like it began as a discovery that took years of drilling and study to prove.
Four things slow a new mine. Permits, because governments must check the harm to land and water. Finance, because a large mine costs a great deal before it earns anything. Construction, because pits and plants take years to build. And community opposition, because people who live nearby may not want a mine.
Put those years on a calendar. If the average holds, a mine discovered today will not deliver its first copper until around twenty forty-three. That is why a shortage today cannot be fixed by mines that have not been found yet. Only mines that are already in the pipeline can help before then.
8. How much more do we need
Now for the demand side. How much copper will the world want, and how much can it dig?
S&P Global expects demand to rise about fifty per cent, to forty-two million tonnes a year by twenty forty. The growth comes from electric vehicles, power grids, renewables, and now AI.
Here is where the extra copper goes, in S&P Global's figures for twenty forty. About fifteen point seven million tonnes is for the energy transition. About four million is for AI data centres and defence together. The rest, about twenty-three million tonnes, is the ordinary economy.
S&P Global sums up the metal's role in one sentence. It calls copper "the connective artery linking physical machinery, digital intelligence, mobility, infrastructure, communication and security systems". Everything on that list runs on current, and the current runs through copper.
Against that demand stands supply.
S&P Global expects global mine output to peak around twenty thirty, at thirty-three million tonnes. After that, it falls. By twenty forty the gap is about ten million tonnes, a quarter below demand. The International Energy Agency sees a similar shape, with supply about twenty-five per cent short of demand in twenty thirty-five.
The IEA's gap has already moved once. In its twenty twenty-five edition, supply was about thirty per cent short. In its twenty twenty-six edition, it is twenty-five. New projects in Central Africa helped. So the forecast is a moving target, and what moves it is decisions still to be made.
9. Recycling and substitution
There are two obvious answers to a shortage. One is to reuse the copper we already have. The other is to use something else.
Start with scrap. Copper can be melted and refined again and again without losing its quality.
S&P Global says recycled copper is about four million tonnes now. It could reach ten million by twenty forty.
Yet collecting scrap is harder than it sounds.
Recycling has three limits. Collection, because copper is buried in walls, underground and inside machines that last for decades. Quality, because mixed scrap has to be sorted before it can become pure metal. And timing, because copper cannot be recycled until an old product reaches the end of its life.
Now substitution. Aluminium can replace copper in some cables and in overhead lines, and it is lighter. But it carries less current for the same thickness, so a cable has to be thicker, and thicker cables need more room. In a car or a data centre, where space is tight, that trade is often a bad one.
The International Energy Agency adds a note of caution about recycling in general.
Across key energy minerals, the IEA says recycling rates could rise from around ten per cent today. It expects close to twenty per cent by twenty forty. Copper already has established recycling streams, so it starts ahead.
10. Tariffs and geopolitics
Copper is also a political metal. Who mines it, who refines it and who taxes it can matter as much as the geology.
The United States acted in twenty twenty-six. On the second of April, it signed a proclamation under Section 232, a law that lets the president restrict imports for national security. From the sixth of April, most semi-finished copper products faced a fifty per cent tariff, and copper-heavy derivative goods faced twenty-five per cent.
A lower rate applied where a product's copper had been entirely smelted and cast in the United States. And in June, a second proclamation extended reduced rates on some derivative goods through the end of twenty twenty-seven.
Traders had already been shipping copper toward the United States ahead of these tariffs, and some metal also moved toward China. Those flows help explain why New York prices ran above London's in the price records we saw earlier.
On the map are four places at the centre of this story. Congo and Indonesia supply the ore. China refines about half of the world's copper. And traders are moving metal towards warehouses in the United States. Each has its own interests, and the interests do not line up.
There is a fourth force called resource nationalism. It means a government tries to keep more of the value of its minerals at home. It might do that through taxes, through limits on exports, or by requiring that ore is processed in the country. It is understandable, but it adds friction, and in a tight market friction raises prices.
11. Can the gap close?
We have followed copper from the ore to the wire, and from the price to the forecast. So can the gap close?
The IEA's figure gives a starting point. Its forecast for the twenty thirty-five gap moved from about thirty per cent to about twenty-five. New projects in Central Africa did that. So new mines are helping, but they take years, and the gap has not gone away.
There are four ways to narrow it.
These are the four levers. New mines, which take about seventeen years. Efficiency, which means using less copper for the same job. Recycling, which means getting more from scrap. And demand response, which means that when copper is expensive, some buyers delay or switch to something else.
The case for going forwards is real. High prices that make more projects worth building. Recycling that S&P Global expects to more than double. Engineers who can design machines that need less metal. And forecasts that change when projects are approved.
The case for holding backwards is also real. Mines take seventeen years. Ore grades keep falling. Refining is concentrated in one country. And a single accident at a big mine can move the whole market.
So does copper hold back the electric age? The forecasts say copper can slow the electric age. They do not say it must stop it.
The numbers to hold on to are these. Demand of forty-two million tonnes by twenty forty. A gap of about ten million tonnes. And an average of seventeen years to open a mine. Forwards or backwards depends on how quickly the world starts digging, saving and recycling.
That is the metal the electric age is running out of. Whether it runs out depends on what is decided now.
Sources and credits
Photo credits (Wikimedia Commons)
- Grasberg copper mine, Papua, Indonesia: Kementerian Energi dan Sumber Daya Mineral Republik Indonesia, Public domain - https://commons.wikimedia.org/wiki/File%3ATambang_Grasberg_Freeport.jpg
- Bingham Canyon Mine, Utah, 1942: Andreas Feininger, Public domain - https://commons.wikimedia.org/wiki/File%3ABingham_Canyon_Mine_1942c.jpg
- Kennecott smelter and Bingham mine, Utah: Bruce McAllister, Public domain - https://commons.wikimedia.org/wiki/File%3AKENNECOTT_SMELTER_AND_MINE_-_THE_LARGEST_OPEN-PIT_COPPER_MINE_IN_THE_WORLD_-_NARA_-_544788.jpg
- Copper mine at Kolwezi, Congo: Rob Mieremet / Anefo, CC0 - https://commons.wikimedia.org/wiki/File%3AKopermijn_te_Kolwezi%2Cin_de_provincie_Shaba_%28Katanka%29%2C_Bestanddeelnr_926-7699.jpg
- Gecamines Lubumbashi copper smelter, DRC: Gécamines (Zairian company), Public domain - https://commons.wikimedia.org/wiki/File%3AGecamines_Lubumbashi_copper_smelter.jpg
- Electrolytic copper refining room, Gecamines Luilu refinery, Kolwezi: Gécamines (Zairian company), Public domain - https://commons.wikimedia.org/wiki/File%3ARoom_where_copper_is_electrolyzed_at_the_Gecamines_Luilu_refinery_near_Kolwezi.jpg
- Escondida copper mine, Atacama Desert, Chile: The image was taken by the the Expedition 22 crew., Public domain - https://commons.wikimedia.org/wiki/File%3AEscondida_Copper_Mine%2C_Atacama_Desert%2C_Chile_2009-12-09.jpg
- Cerro Verde copper mine, Peru: NASA Operational Land Imager (OLI) on Landsat 8, Public domain - https://commons.wikimedia.org/wiki/File%3ACerro_Verde_mine_Peru.jpg
- Morenci copper mine, Arizona: Unknown authorUnknown author or not provided, Public domain - https://commons.wikimedia.org/wiki/File%3ACoronado_Trail_Scenic_Byway_-_Morenci_Copper_Mine_-_NARA_-_7717810.jpg
- Overhead high-voltage transmission line: Rsparks3, CC0 - https://commons.wikimedia.org/wiki/File%3AOverhead_transmission_line.jpg
- Data-centre server rack cabling: Derrick Coetzee from Berkeley, CA, USA, CC0 - https://commons.wikimedia.org/wiki/File%3ARear_of_rack_at_NERSC_data_center_-_closeup.jpg
- Coiling copper wire for an electric motor: U.S. Navy photo by Photographer's Mate Airman Ron Reeves, Public domain - https://commons.wikimedia.org/wiki/File%3AUS_Navy_040806-N-0684R-010_Electrician%27s_Mate_Fireman_Brian_Thompson_from_Fresno%2C_Calif._coils_copper_wire_for_the_inside_of_an_electric_motor.jpg
- Power transformer with cut-open windings: unknown, Public domain - https://commons.wikimedia.org/wiki/File%3ATMW_50971_Transformatorschenkel_eines_Leistungstransformators_mit_aufgeschnittenen_Wicklungen.jpg


Primary sources
- Investing News Network, 'What Was the Highest Price for Copper?', updated 2026, citing CME/COMEX and LME data - LME three-month record $14,858/t on 9 Sep 2026 (from $14,708.50 on 8 Sep); COMEX record $6.89/lb on 9 Sep 2026 (from $6.87 on 8 Sep).
- Mining.com, 'Copper price holds near record as London warehouse bidding war looms', 14 August 2026 - LME warehouse stocks 204,975 tonnes after 42 days of falls; metal flows toward the US and China; Chinese smelters cutting output on tight concentrate.
- S&P Global, 'Copper in the Age of AI', press release, 8 January 2026 - 42 Mt demand by 2040, supply peak 33 Mt in 2030, gap about 10 Mt (25%), scrap 4 Mt to 10 Mt, 17-year average mine lead time, data-centre capacity about 550 GW in 2040.
- IEA, Global Critical Minerals Outlook 2026, executive summary - supply about 25% short of 2035 demand (about 30% in the 2025 edition); China about 50% of copper refining capacity; base metals up one third, January 2025 to April 2026.
- Freeport-McMoRan, first-quarter 2026 results, 23 April 2026, and second-quarter 2026 results, 23 July 2026 (SEC 8-K exhibits 99.1) - Grasberg Block Cave restart, about 3.1 billion pounds of 2026 sales, 65% in the second half of 2026, 80% by mid-2027, full capacity by end 2027.
- Ivanhoe Mines, Kamoa-Kakula guidance releases, 3 December 2025 and 31 March 2026 (updated independent study results) - seismic activity of 20 May 2025, 2026 guidance 380,000-420,000 t then cut to 290,000-330,000 t.
- MINING.COM, 'BHP halts operations at Escondida following fatal accident', and Reuters via Investing.com, Sep 2026 - contractor died in a front-end-loader accident, 23 September 2026; BHP suspended all operations at Escondida pending a Sernageomin investigation; no restart date given.
- Cochilco forecast, reported by Miningreporters, 19 January 2026 - Chile output 5.97 Mt (2027), 5.43 Mt (2030), 6.06 Mt (2033); falling grades.
- The White House, 'Strengthening Actions Taken to Adjust Imports of Aluminum, Steel, and Copper Into the United States', signed 2 April 2026, effective 6 April 2026 (Federal Register, published 9 Apr 2026) - 50% tariff on semi-finished copper, 25% on copper-intensive derivatives, reduced rate for copper entirely smelted and cast in the US; second proclamation, 1 June 2026, effective 8 June 2026, extends reduced rates on more derivatives through 31 December 2027.
Not regulated financial advice.