
Inflation: Why Prices Never Go Back Down
Coffee is up more than 40% since the 2025 tariffs. Electricity keeps climbing on AI data-centre demand. Eggs and petrol both fell. Why do some prices reverse and most never do?
This video explains how inflation is actually measured - the basket, the price level, and why a falling inflation RATE is not the same thing as falling prices - and why central banks target a small, steady 2% rise rather than zero, a template set by New Zealand's Reserve Bank Act of 1989. It covers the two-part ratchet that keeps prices from reversing: downward-sticky wages and multi-year contracts, and the self-fulfilling power of inflation expectations.
It then covers the one case where prices genuinely do fall for years - Japan's 1995-2013 deflation - and why that is a warning sign of a broken economy, not a healthy one, because of the debt-deflation spiral and the zero lower bound that strips a central bank of its main tool.
The second half is the live 2025-2026 case: new US tariffs of 50% on Brazil, 20% on Vietnam and 19% on Indonesia pushed ground coffee up more than 40% in a year; Fed Chair Jerome Powell called the effect a 'one-time shift in the price level', while the Fed's own forecasts crept upward anyway. A separate flat 10% Section 122 surcharge was ruled invalid by a US trade court in May 2026 and later expired on its own statutory clock - legally distinct from the coffee tariffs, which remain in force. Data-centre demand pushed PJM's wholesale power price up 75.5% in Q1 2026, a second driver behind rising household electricity bills that has nothing to do with tariffs at all.
It closes on the two prices that did fall - eggs, as flocks recovered from avian flu, and petrol, on a global supply glut - and on what it would actually take for a genuine, broad fall in prices: a demand collapse or a supply glut across the whole economy, both rare, and both painful when they happen.
Every figure is on screen with its source and date.
In these topics
Chapters
- The Prices That Never Came Back
- What Inflation Actually Measures
- Why 2%, Not Zero
- The Ratchet: Wages and Contracts
- The Ratchet: Expectations
- When Deflation Does Happen, It's a Warning
- The Zero Lower Bound Trap
- The 2025-2026 Tariff Shock
- 'One-Time' Versus Persistent
- The AI Power Bill
- The Exceptions: What Did Fall
- What Would Actually Have to Break
Video notes
1. The Prices That Never Came Back
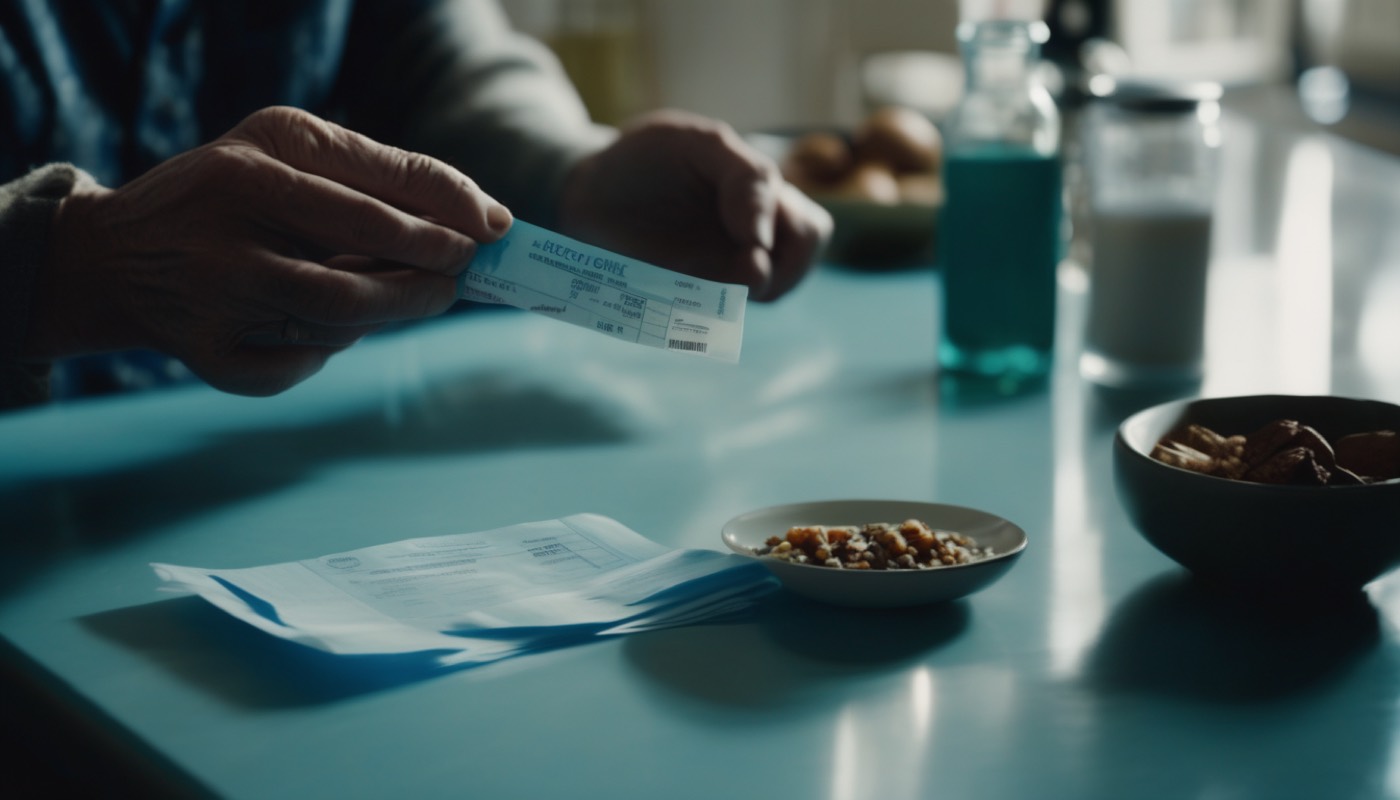
Pull up a grocery receipt from 2021 and set it beside one from today, and almost every number on it only ever moved one way.
A pound of ground coffee that cost around six dollars before the recent round of tariffs now costs more than nine dollars at the till. A typical household electricity bill, meanwhile, kept climbing right through 2025 and into 2026.
Eggs are the one exception that proves the rule.
A shortage drove egg prices sharply higher, and then, as the shortage eased, egg prices actually came back down. That almost never happens to a price level once it has risen — which is exactly why this one case stands out.
Coffee went up and stayed up. Electricity went up and kept going up. Eggs went up, then came back down, because the specific cause behind the spike went away — not because prices in general ever reverse on their own.
This video explains how inflation is actually measured, and why central banks aim for a small, steady rise in prices rather than none at all. It also explains why wages, contracts and plain expectation turn an ordinary price rise into something that almost never unwinds, and what the 2025 and 2026 tariffs did to specific prices even while the overall rate of inflation was cooling.
By the end, you will know exactly what it would take for prices to fall across the board. That turns out to be far rarer, and far more painful, than it sounds.
2. What Inflation Actually Measures

"Inflation" sounds like one number, but it is actually a comparison between two things: a basket, and its price.
The basket is a fixed list of everything an average household buys, priced in roughly the same quantities every time. Rent, groceries, fuel, haircuts and insurance are all in it. Pricing that same basket every month gives you the price level: what the whole basket costs today, compared with what it cost before.
The Consumer Price Index, or CPI, is the most widely quoted way of tracking that price level.
The Bureau of Labor Statistics prices the same basket of goods and services every month and reports the result as the Consumer Price Index. The inflation rate you hear on the news is simply how much that index moved over the last year — not the level itself, and not any single item in the basket.
Core PCE is a second, closely related measure, and it is the one the Federal Reserve itself actually targets.
Core PCE strips out food and energy prices, because those two categories swing around for reasons that have nothing to do with the underlying trend the Fed is trying to read. It is built from business spending data rather than a household survey, which is why its number is sometimes a little different from CPI in a given month.
Here is the distinction that this whole video rests on: the inflation rate falling is not the same thing as prices falling.
A falling inflation rate means the basket is getting more expensive more slowly than it was. The price level itself — what things actually cost — is still going up, just not as fast. For prices to actually fall, the inflation rate would have to go negative, not just smaller.
That gap between "slower" and "backwards" is where almost every misunderstanding about this subject lives.
3. Why 2%, Not Zero
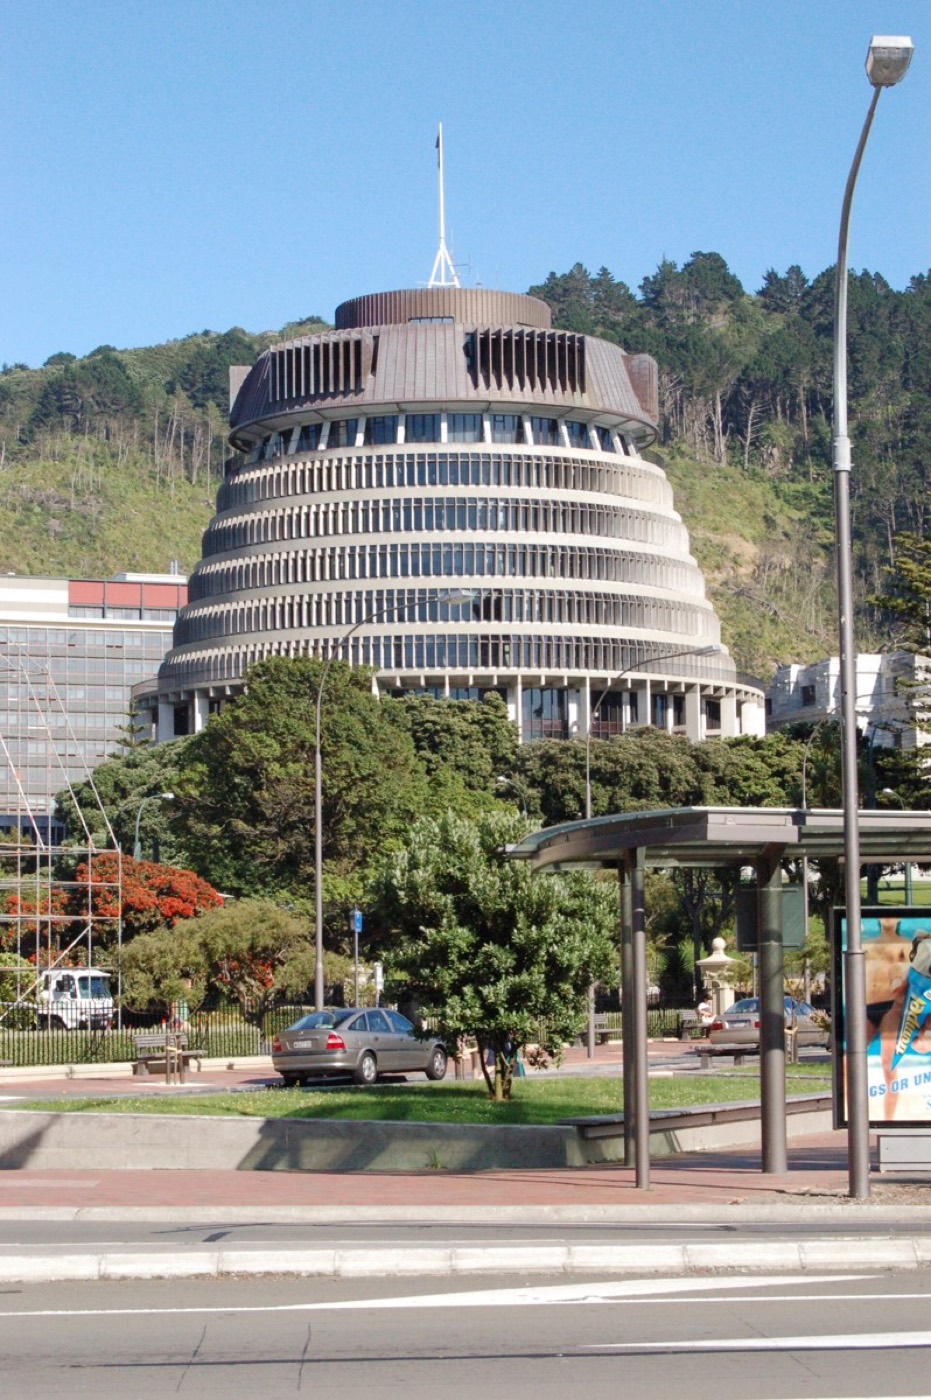
If rising prices are the ratchet this video is about, the obvious question is why any central bank would target a positive number at all. Why not aim for zero?
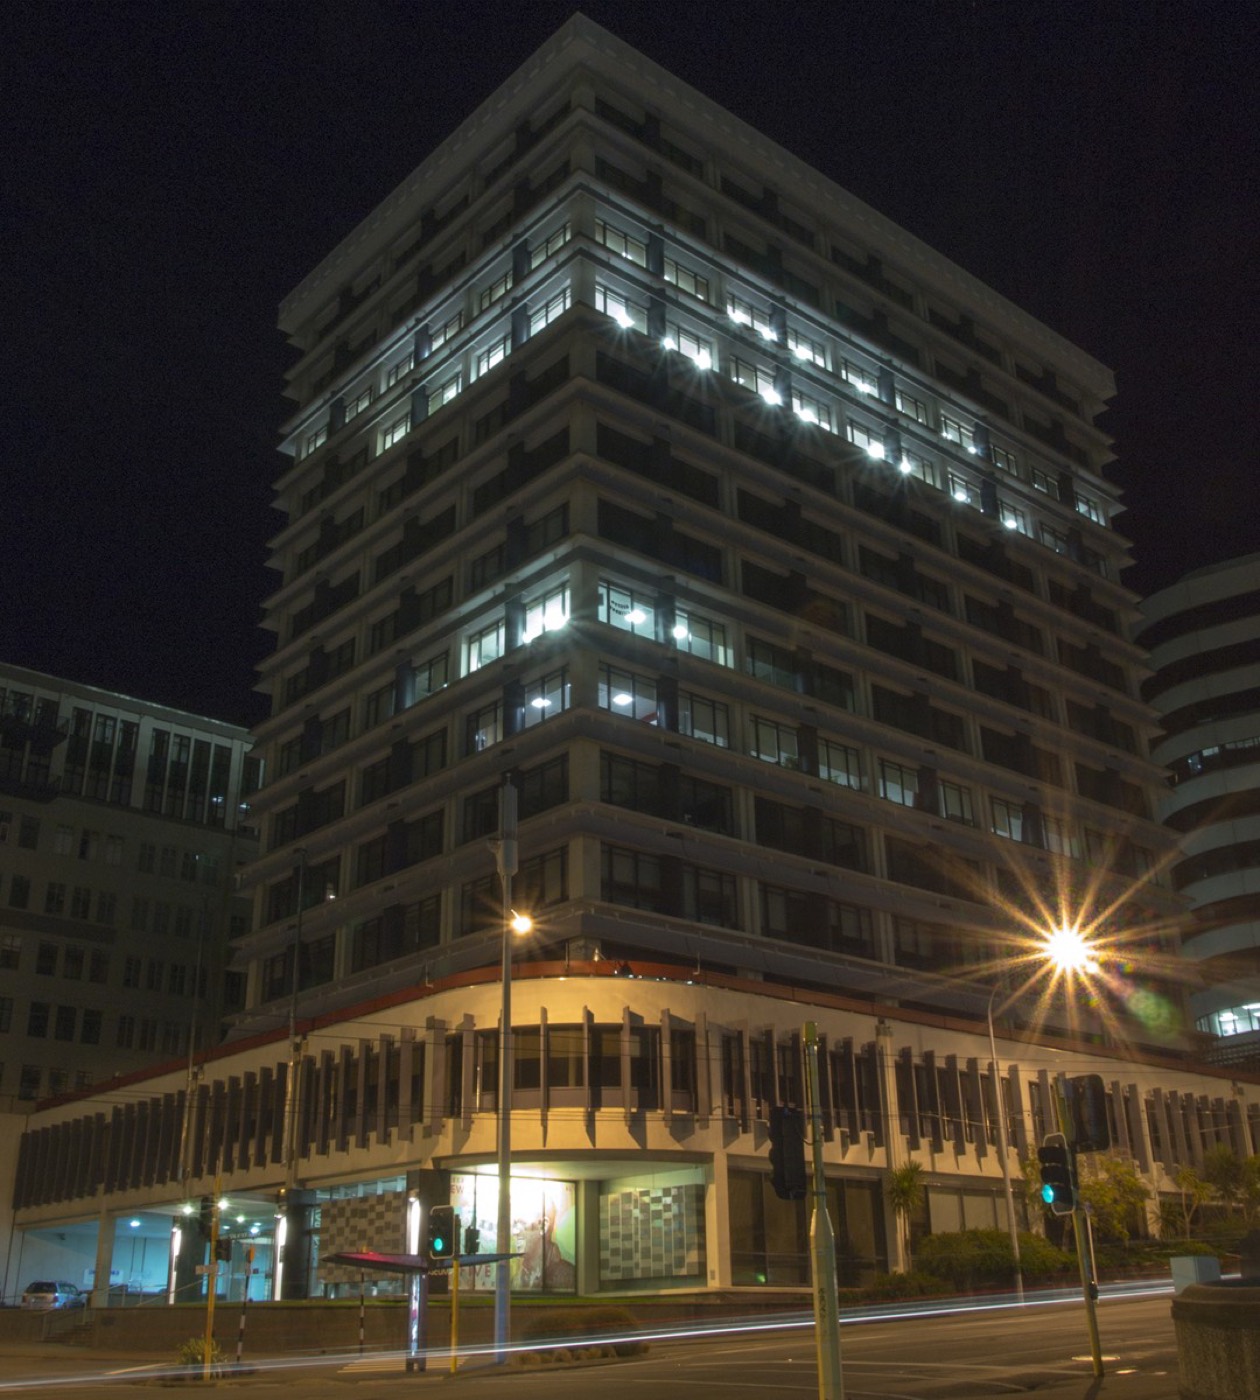
New Zealand answered that question first. Its Reserve Bank Act, given royal assent on the twentieth of December 1989, made it the first country in the world to write a numerical inflation target into law — an initial band of zero to two per cent.
This is the Reserve Bank of New Zealand's building in Wellington, where that 1989 law took effect.
And this is New Zealand's Parliament, the Beehive, also in Wellington — where the Reserve Bank Act was passed into law in the first place.
New Zealand's choice of a small positive number, rather than zero itself, became the template nearly every other major central bank eventually copied.
The Bank of Japan took the opposite path for years, tolerating prices that barely moved or slipped backwards. It did not adopt an explicit two per cent target until January 2013, under Governor Haruhiko Kuroda. The Federal Reserve settled on the same two per cent goal for core PCE back in 2012.
Nearly every major economy has now converged on roughly the same number, for the same reason: room.
A small, positive buffer gives a central bank space to cut its interest rate further in a genuine downturn, before that rate hits a floor near zero. Aiming for exactly zero inflation leaves almost no room at all — one bad year of weak demand, and the economy is already at the floor with no cut left to give.
That floor is important enough that it gets its own chapter later in this video — because when a country does fall through it, the result is not mild.
4. The Ratchet: Wages and Contracts

The first reason a price rise rarely reverses has nothing to do with central banks. It is how pay actually works.
Economists call this downward wage stickiness: employers will slow a pay rise, freeze it, or skip it for a year, but they almost never cut an employee's nominal pay outright. Cutting pay directly damages morale and drives away the best people, so firms absorb a weak year by raising wages slower instead — not by lowering them.
That one habit means wages, averaged across an economy, essentially never fall even when demand genuinely weakens.
If wages do not fall when demand drops, then the cost of producing most goods and services does not fall either, because labour is usually the largest cost a business carries. A price built on a cost that will not go down has very little room to go down itself.
Contracts add a second kind of stickiness, on top of wages.
A lease, a union pay agreement, or a long-term supplier contract typically fixes a price or a wage for years at a time. Even if demand collapses the moment the ink is dry, that fixed price cannot move again until the contract itself comes up for renewal. The adjustment a falling price would require is simply delayed, sometimes for years, rather than ever happening quickly.
Multiply that delay across millions of wage agreements and contracts at once, and an entire economy's prices move as if they were one enormous ratchet: each one clicks up easily, and very few click back.
5. The Ratchet: Expectations

Wages and contracts explain why prices are slow to fall. Expectations explain why they keep rising even when nothing else is forcing them to.
Once workers and firms come to believe prices will keep rising at roughly some rate, that belief changes their behaviour before a single price has actually moved. Workers ask for a raise that assumes next year's prices will be higher; firms set next year's prices assuming costs, including wages, will be higher too.
That is the loop: expected inflation becomes an input into the wage demands and price-setting decisions that go on to produce the inflation that was expected.
A worker who expects prices to rise five per cent asks for a raise of at least that much, just to keep up. A business that expects to pay that raise sets its own prices higher to cover it. Multiply that single exchange across an entire economy, and the expectation has largely written its own answer — not because anyone broke a rule, but because everyone was reacting to a belief that turned out to be shared.
This is why central banks talk so much about keeping expectations "anchored" — a phrase that means, quite literally, stopping that belief from drifting upward on its own.
If everyone expects two per cent inflation, wage and price decisions settle into a pattern consistent with two per cent. If that expectation drifts to five per cent instead, decisions settle into a pattern consistent with five per cent — and nothing about the underlying economy had to change for the result to be entirely different. The belief itself is doing real economic work.
That is the second half of the ratchet: not just that costs resist falling, but that everyone now expects them to rise, and acts accordingly.
6. When Deflation Does Happen, It's a Warning
Given how strong that upward ratchet is, an economy where prices genuinely fall for years is not healthy. It is broken.
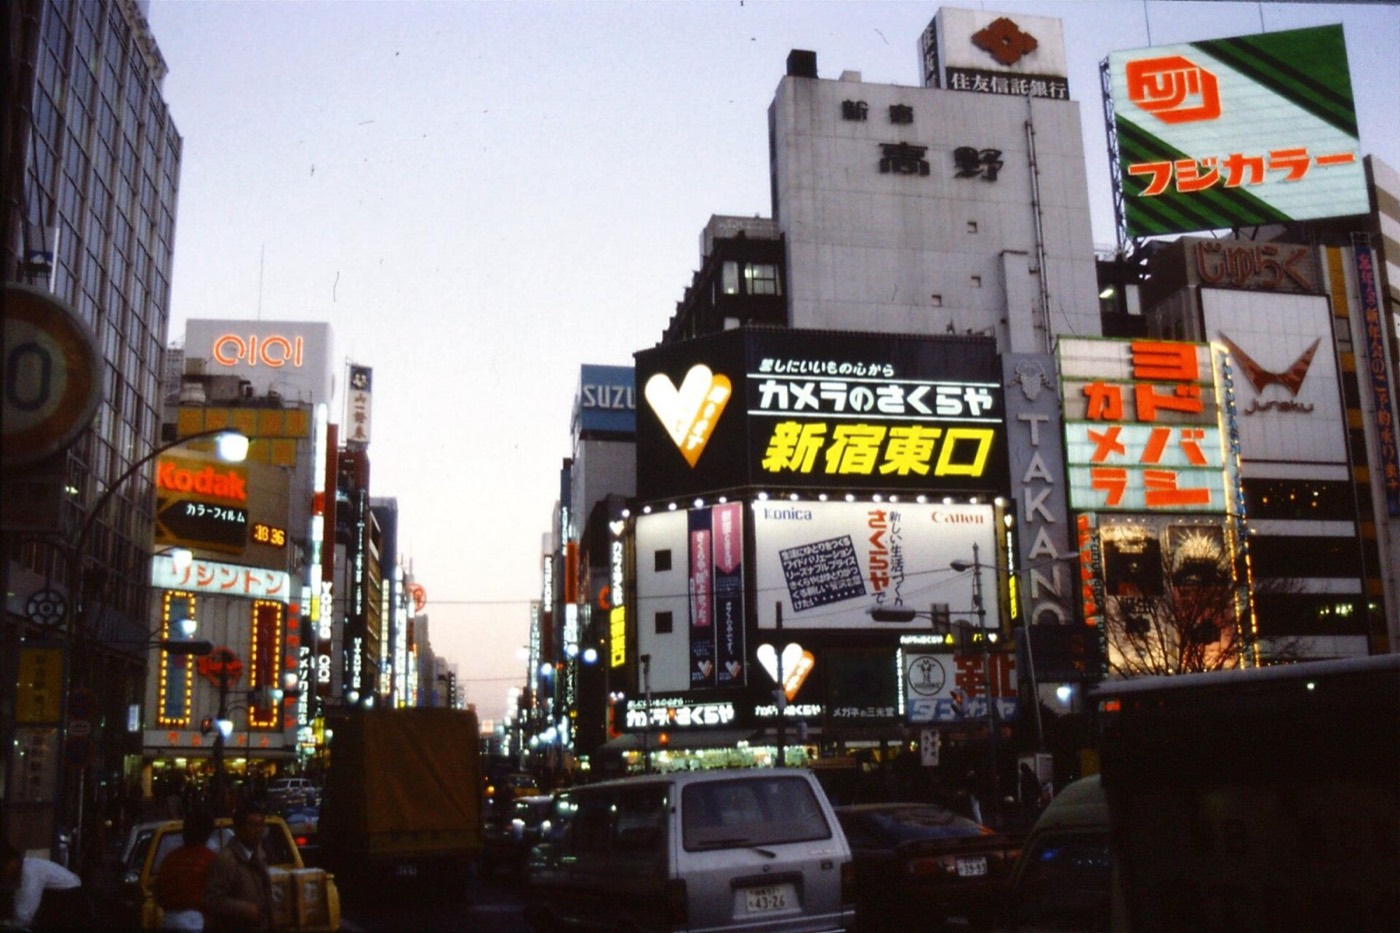
Tokyo's streets in the late 1980s were a picture of frantic, overheated spending, fed by a bubble in property and stocks across Japan. That bubble collapsed at the start of the 1990s. The country then endured roughly eighteen years of on-and-off deflation and price stagnation, starting in the mid-1990s. Only in January 2013 did the Bank of Japan finally adopt its explicit two per cent inflation target.
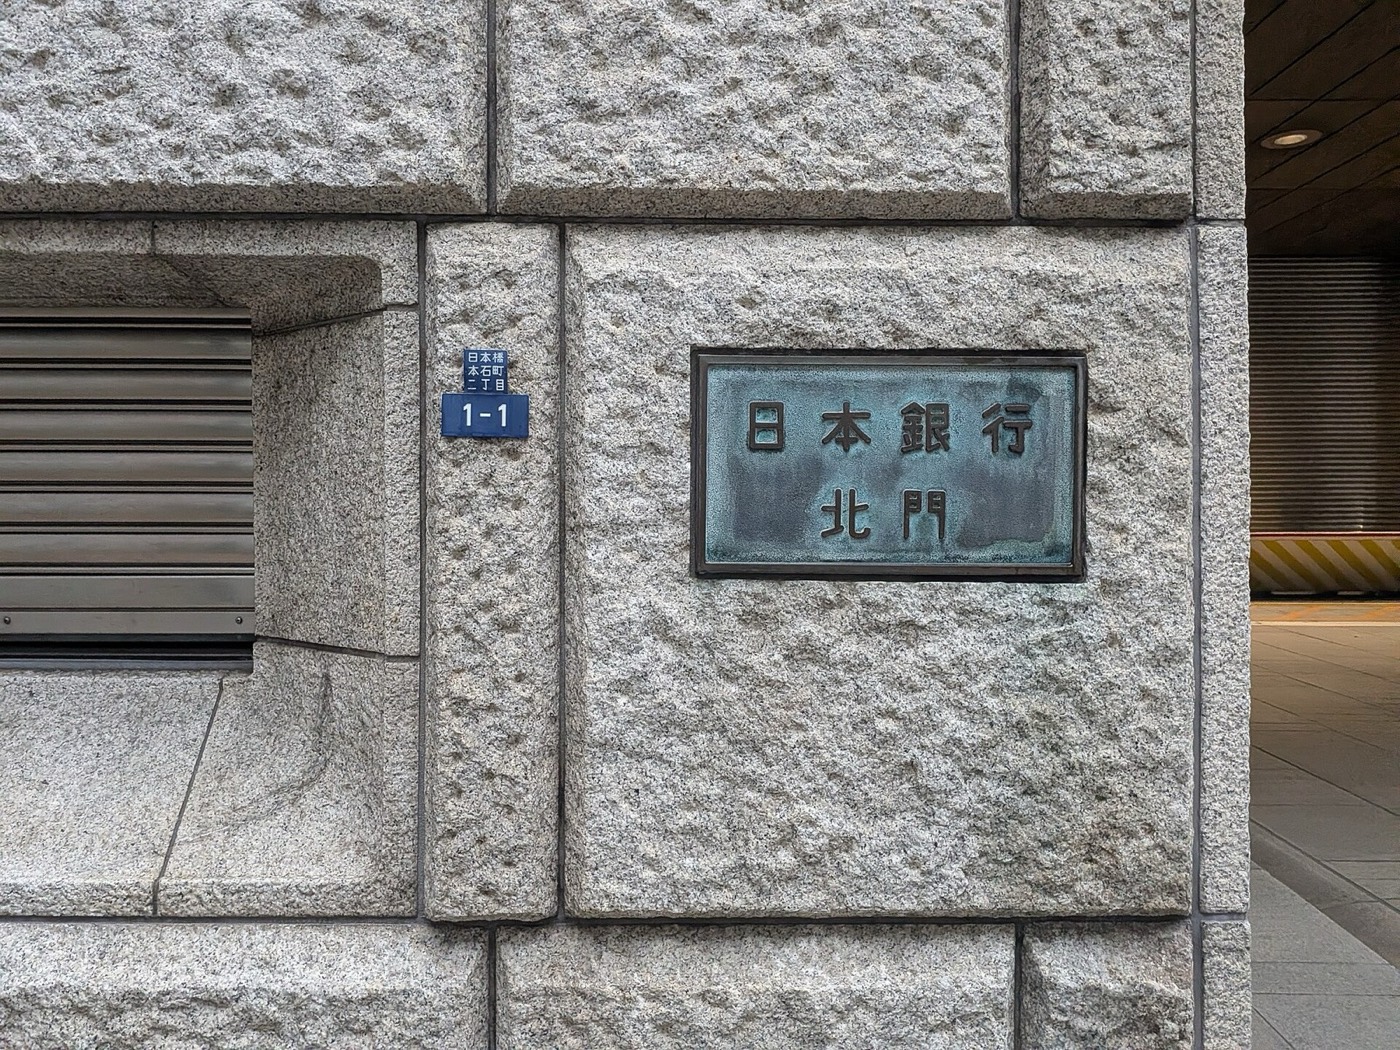
This is the Bank of Japan's head office, in Tokyo — the institution that spent most of this period fighting deflation, not inflation.
A Tokyo street scene from the late 1980s, just before the bubble that caused all of this finally burst.
For most of that period, Japanese consumer prices barely moved, and in several years they fell outright. Falling prices sound like relief for anyone with cash to spend. For an economy carrying debt, they are closer to the opposite.
This is what economists call a debt-deflation spiral. Prices fall, but a fixed debt — a mortgage, or a business loan — does not fall with them. The income used to repay it keeps shrinking, while the debt itself stays exactly the same size. Businesses and households cut spending to cope, which pushes prices down further, which makes the same debt heavier again.
Japan's period is the clearest real-world illustration of why central banks fear deflation more than they fear modest inflation.
Consumers who expect next year's prices to be lower have a rational reason to delay a purchase today, and a delayed purchase today is lost spending that makes the economy weaker and prices fall further still. That is the opposite of the ratchet this video started with — a downward spiral that feeds itself, rather than an upward one.
A rare case of prices actually falling, then, is not the exception that disproves the ratchet. It is what the ratchet breaking looks like, and it has a cost of its own.
7. The Zero Lower Bound Trap
Japan's spiral exposes the specific tool a central bank loses once genuine deflation sets in, and it is the same tool behind the 2% target from chapter three.
A central bank's main lever is its policy interest rate: cut it, and borrowing and spending become more attractive, which is meant to push a weak economy back toward normal. That lever stops working in the usual way once the rate is already at, or close to, zero — a limit economists call the zero lower bound.
The floor is not just a round number. It comes from a simple alternative everyone always has.
Nobody will reliably lend money at a meaningfully negative interest rate, because holding physical cash at zero per cent is always available instead, and cash never charges you for holding it. That alternative is what makes cutting much below zero unworkable as an everyday policy tool, rather than a decision anyone could simply choose to override.
Two recent downturns show exactly how little room that leaves.
Going into the 2008 financial crisis, the Federal Reserve's policy rate was above five per cent, giving it a wide path to cut. By 2020, the rate was already near zero before that year's shock even began, which left almost no room to cut further through the usual channel — one major reason the Fed and other central banks turned to less conventional tools instead.
A 2% inflation target exists precisely so that gap never opens up — it keeps interest rates away from that floor in normal times, leaving room to cut when a real downturn eventually arrives.
8. The 2025-2026 Tariff Shock

Against that backdrop, the United States spent 2025 and 2026 running a live experiment in what happens when a government deliberately pushes specific prices higher.
Starting in 2025, the US imposed steep new tariffs on coffee imports from its three largest suppliers — Brazil, Vietnam and Indonesia. A tariff is simply a tax charged on goods as they cross the border, and whoever imports the coffee has to pay it before a single bag reaches a US shelf. Brazil's rate alone reached fifty per cent.
Coffee is almost entirely imported into the United States, which means there was no domestic alternative supply to soften the blow.
By September 2025, ground coffee had jumped more than forty per cent in a single year. By April 2026, the price had climbed further still, before easing only slightly over the following months.
Coffee was not the only target. A separate, broader tariff briefly touched almost everything the US imports at once.
In February 2026, the government added a flat ten per cent surcharge on top of existing tariffs on most imports. It was issued under a trade-law provision called Section 122. A US trade court ruled in May 2026 that this specific surcharge had exceeded what that law actually allowed. The surcharge itself then expired in July 2026, under a legal time limit built into the statute. But the court's ruling applied only to that flat, across-the-board charge — the country-specific coffee tariffs above were a separate legal action, and were not affected by it.
So one tariff came and went within months. The other — the one actually driving coffee's price higher — is still in force.
9. 'One-Time' Versus Persistent

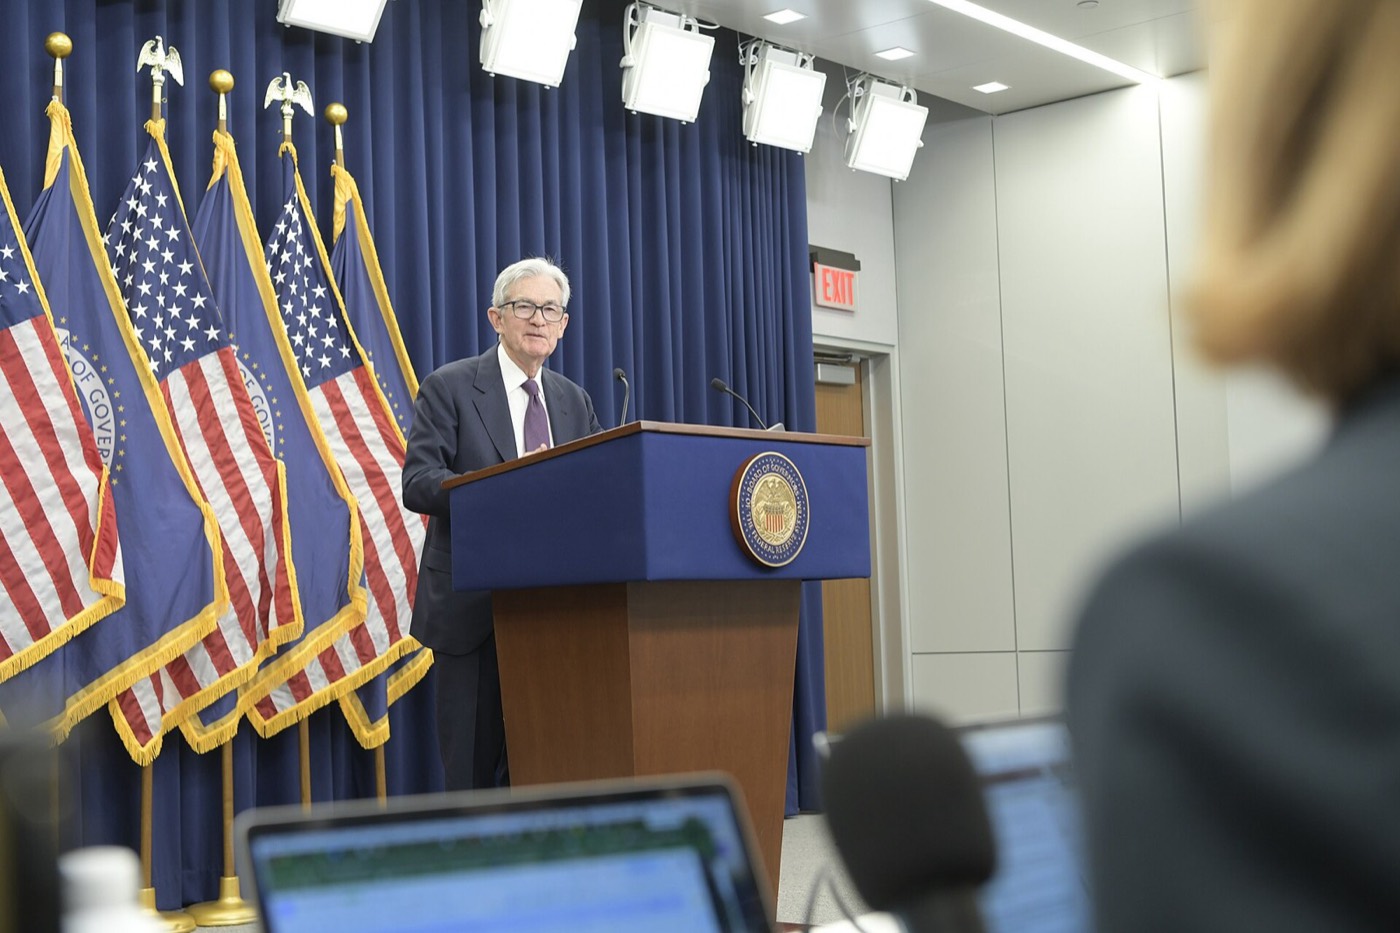
Fed Chair Jerome Powell gave the tariffs' effect on prices a name in October 2025, and it was a deliberately reassuring one.
"A reasonable base case is that the effects of tariffs on inflation will be relatively short-lived — effectively, a one-time shift in the price level," Powell told reporters at an October 2025 press conference. A one-time shift means prices move up once and then settle at the new, higher level — rather than continuing to climb year after year.
Powell did not rule out the less comfortable alternative, either.
Powell also allowed for the less comfortable alternative: that the effects could be more persistent instead, depending on how large the tariffs turned out to be and how long it took them to fully reach the shelf. Keeping that door open mattered, because the Fed's own forecast for underlying inflation was already moving in the wrong direction.
The Fed's own September 2025 projections for core PCE — the measure from chapter two — show exactly that drift.
The Fed's own September 2025 projections for core PCE showed its forecast for 2025 revised upward. Its 2027 forecast, further out still, sat above the Fed's own two per cent target too. Every year it was willing to forecast came in above that target, not at it.
And the coffee data itself, by late summer 2026, was telling a genuinely mixed story — neither Powell's reassuring case nor its opposite, cleanly.
Ground coffee eased back from its spring 2026 peak by August — a real improvement, but still well above where it stood before the tariffs began. "One-time shift" and "persistent problem" were both half right: the price stopped climbing, but it never went back.
10. The AI Power Bill
Coffee had one clear cause. The second price this video opened with — electricity — has a cause that has nothing to do with tariffs at all.
Data centres built to run artificial intelligence draw enormous, continuous amounts of electricity, and demand for that power has been growing faster than new power plants and transmission lines can be built to meet it. That mismatch between fast-growing demand and slow-growing supply pushes the wholesale price of electricity higher — before a single household bill is even written.
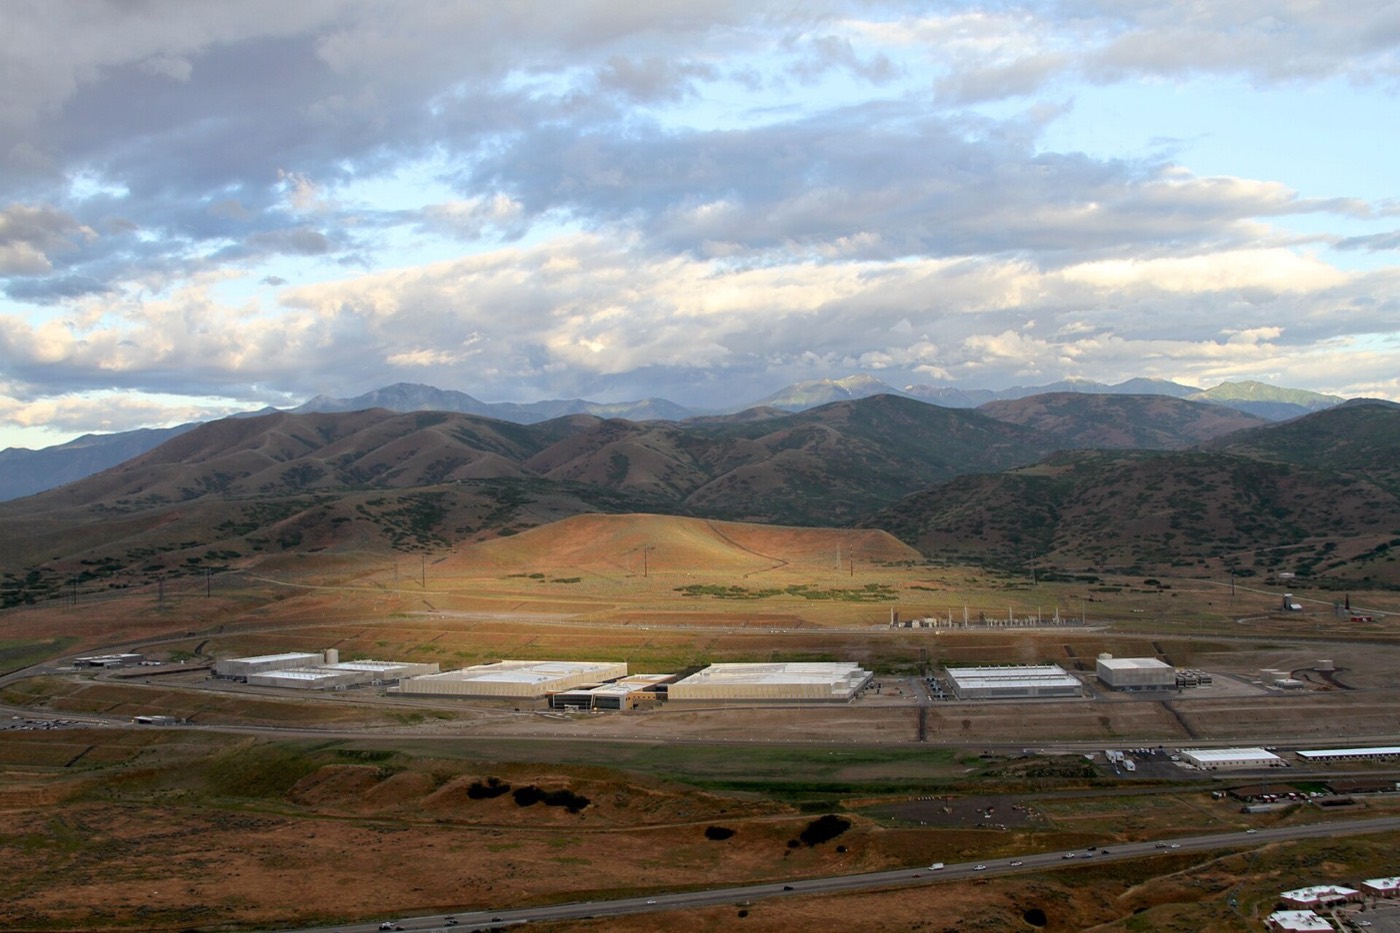
This is a large-scale US data centre, one of the buildings now driving that extra demand.
PJM, the operator running the electrical grid across a large stretch of the eastern United States, put a number on exactly how much higher.
Wholesale power costs across PJM's territory jumped sharply in the first quarter of 2026, compared with a year earlier, taking the average price per megawatt-hour to its highest level in years. PJM's own market monitor named forecast data-centre demand as the primary reason capacity auctions were producing prices that high.
That wholesale increase works its way down to an ordinary household bill, just more slowly.
Average US residential electricity prices rose about seven per cent in the year to April 2026. Government forecasters expect a further rise of a little over four per cent in 2026 as a whole. Unlike coffee, there is no tariff to repeal here and no court to rule on — the demand pushing this price up is simply real, and it is not going away.
A second, entirely separate driver of the same prices-that-never-came-back story — this one with no tariff attached at all.
11. The Exceptions: What Did Fall
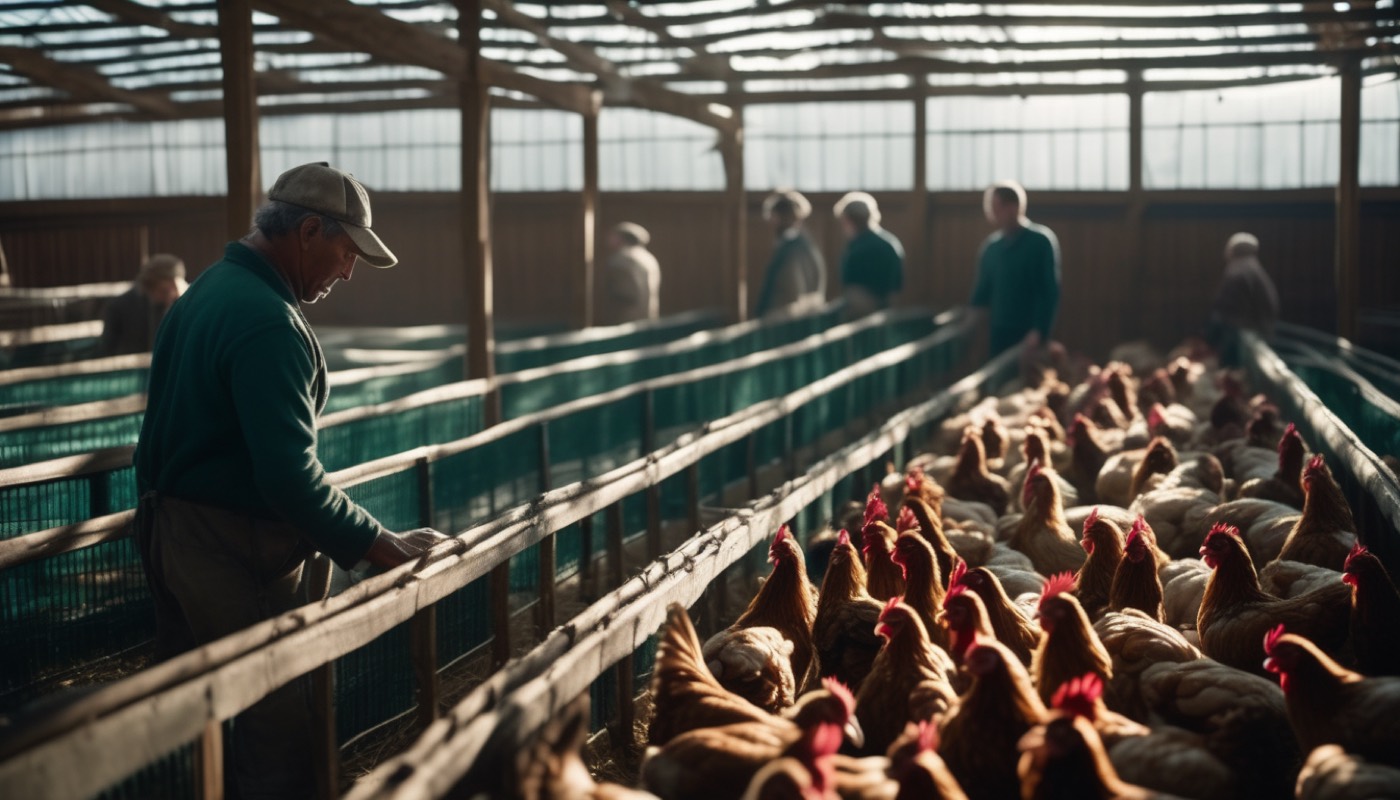
Two prices in this video's opening did fall: eggs, and fuel. Both are worth taking seriously, because both show exactly why a falling price is the exception, not evidence against the rule.
Egg prices spiked in 2024 and 2025 after a severe outbreak of avian flu devastated egg-laying flocks across the country. Once the outbreak eased in 2025, farms rebuilt their flocks and supply recovered. Government forecasters now expect retail egg prices to fall by roughly twenty-seven per cent in 2026 — the only major food category forecast to fall at all.
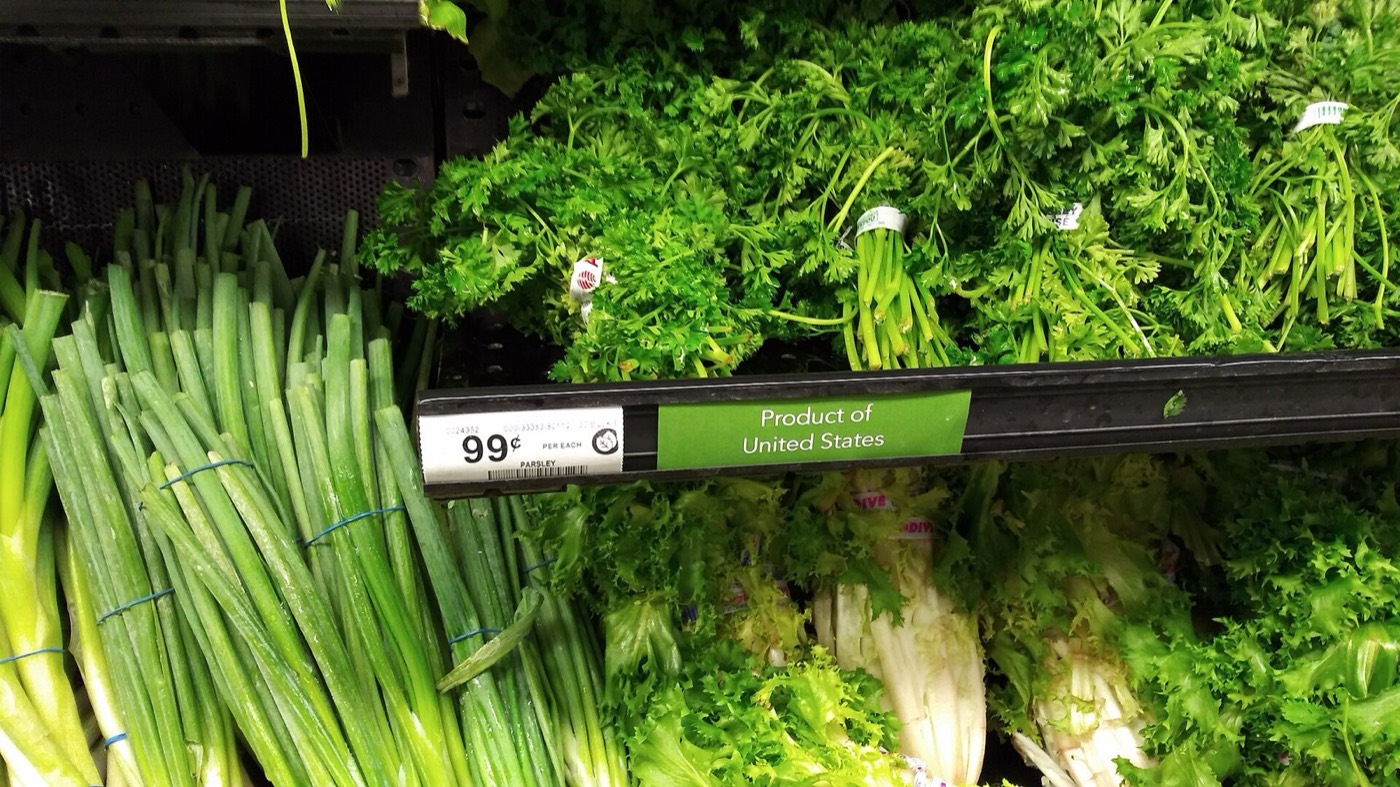
This is an ordinary US supermarket aisle, shelf prices in plain view — the actual place where all of this is felt.
Gasoline tells a similar story, driven by a completely different cause.
US gasoline prices fell for a third straight year in 2025, as increased global oil supply outpaced demand. They averaged a little over three dollars a gallon for the year. Forecasters expect prices to fall further in 2026, potentially below three dollars a gallon for the first time since the pandemic.
Notice what both cases have in common, because it is the opposite of coffee and electricity.
Eggs fell because a temporary shortage, caused by disease, simply ended. Fuel fell because of a global oversupply of oil that has nothing to do with US policy at all. Neither case involved wages falling, contracts resetting, or expectations shifting — the three forces this video spent four chapters on. Remove a temporary shock, and a price can fall. Nothing about the underlying ratchet moved.
Food-at-home prices overall are still forecast to rise in 2026, even with eggs falling sharply. One exception inside a basket that, on average, still only goes up — that is the clearest illustration available.
12. What Would Actually Have to Break

Put all of that together, and the answer to this video's opening question comes into focus — and it is not a comforting one.
A genuine, broad fall in the price level needs one of two things. Either demand collapses hard enough, across enough of the economy at once, to force wages and prices down everywhere despite their stickiness. Or a true supply glut makes a huge range of goods and services simply too abundant to charge the old price for. Both are rare. Both, in Japan's case and in any serious demand collapse, are also painful.
That is why a genuine return to normal prices almost never happens on purpose, and almost never happens gently.
Coffee and electricity prices rose for real, specific, traceable reasons — tariffs on one, data-centre demand on the other. Both are likely to stay largely where they landed, exactly the way wages, contracts and expectations predict. Eggs and fuel fell because their specific causes genuinely reversed, not because the general rule broke.
So: does the cost of living ever move backwards? Occasionally, for one product at a time, for a reason that can be named. The price level as a whole is a ratchet, not a pendulum — and now you know exactly why, and exactly what it would take to prove this video wrong.
Sources and credits
Photo credits (Wikimedia Commons)
- Jerome Powell, Federal Reserve Chair, answering reporters' questions at an FOMC press conference: Federalreserve, Public domain - https://commons.wikimedia.org/wiki/File%3AChairman_Jerome_Powell_answers_reporters%27_questions_at_the_FOMC_press_conference_%2855239092858%29.jpg
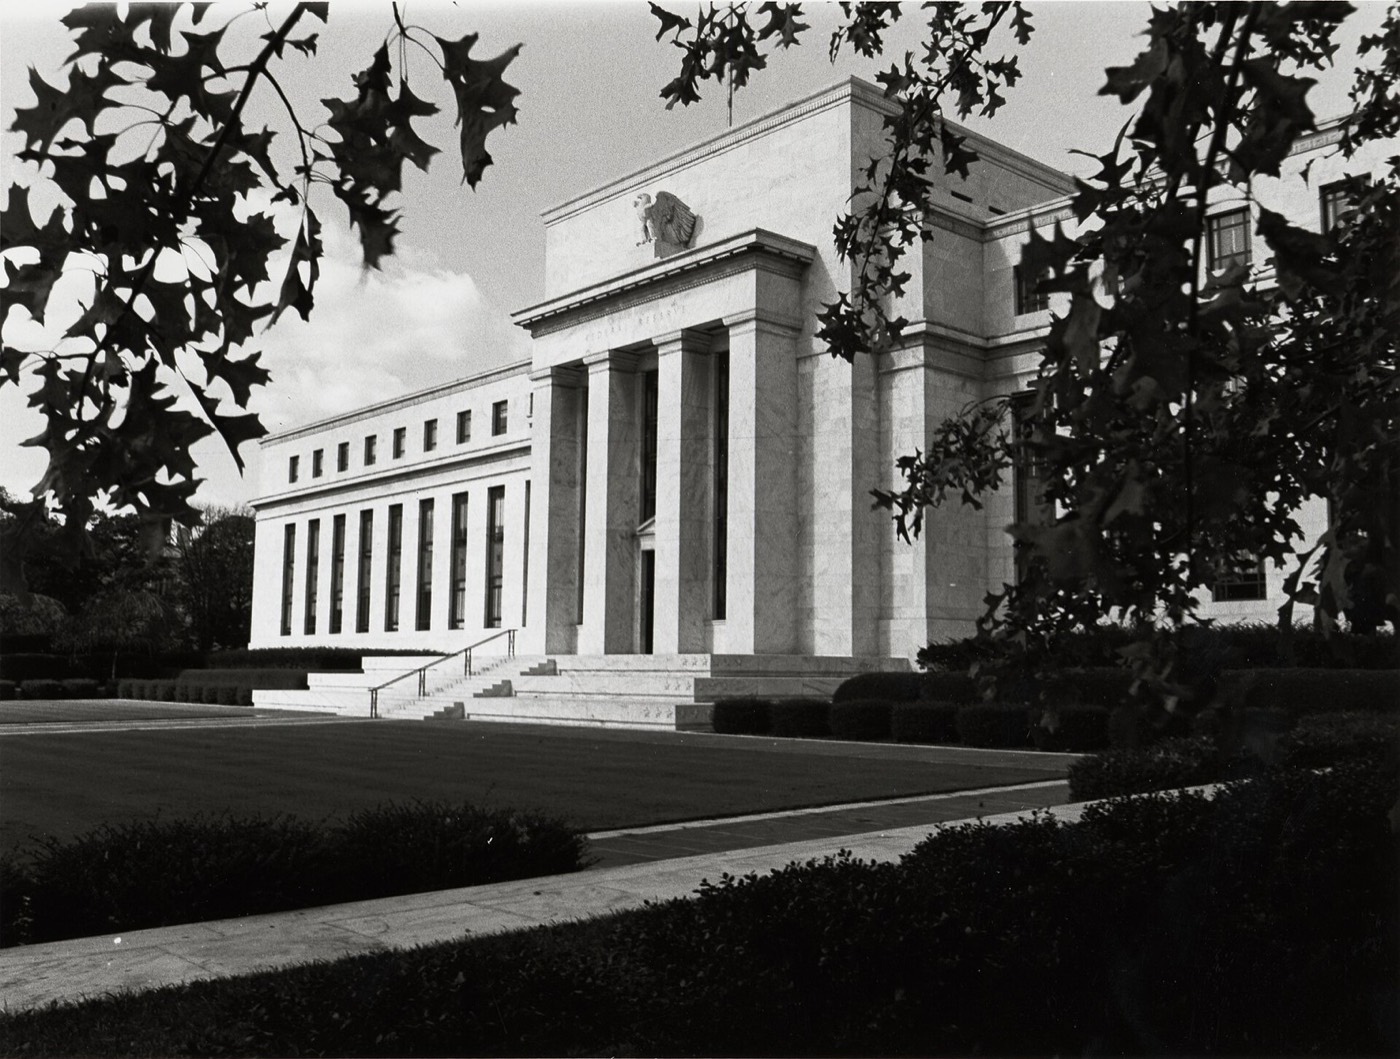
- Marriner S. Eccles Federal Reserve Board Building, Washington DC (1937): Federalreserve, Public domain - https://commons.wikimedia.org/wiki/File%3AUS_Federal_Reserve_Eccles_Building_1937.jpg
- Bank of Japan head office building, Tokyo: Syced, CC0 - https://commons.wikimedia.org/wiki/File%3ABank_of_Japan_building_%2840368%29.jpg
- Tokyo street scene, December 1988: Unknown authorUnknown author, CC0 - https://commons.wikimedia.org/wiki/File%3AStreet_view_of_Tokyo_in_December_1988.jpg
- Reserve Bank of New Zealand building, Wellington: Clilly4, CC0 - https://commons.wikimedia.org/wiki/File%3AReserve_Bank_of_New_Zealand_building%2C_Wellington.jpg
- New Zealand Parliament Buildings (the Beehive), Wellington: User: (WT-shared) ED01 at wts wikivoyage, Public domain - https://commons.wikimedia.org/wiki/File%3ABeehive_%28New_Zealand_Parliament_Building%2C_Wellington_New_Zealand%29.jpg
- US supermarket produce aisle with shelf prices, Clearwater, Florida, 2020: MatthewHoobin, CC0 - https://commons.wikimedia.org/wiki/File%3AParsley_for_99_cents%2C_and_other_vegetables%2C_in_supermarket_in_Clearwater%2C_Florida%2C_US_on_25_September_2020.jpg
- Large-scale US data centre exterior (NSA Utah Data Center, used as a generic hyperscale data-centre building): User:ParkerHiggins (Electronic Frontier Foundation), CC0 - https://commons.wikimedia.org/wiki/File%3AEFF_photograph_of_NSA%27s_Utah_Data_Center.jpg


Primary sources
- Bureau of Labor Statistics, Average Price Data, series APU0000717311 (ground roast coffee, per lb), via FRED, data through August 2026, fetched 3 October 2026 - the $6.47/$9.14/$9.72/$9.30 price points and the partial 2026 easing.
- Bureau of Labor Statistics, CPI 'Coffee' category, 12-month percent change, July 2026 release, via usinflationcalculator.com and BLS reporting, checked 3 October 2026 - the +10.3% y/y figure.
- USTR tariff schedule and trade-press reporting (Barchart, AOL), checked 3 October 2026 - the 50%/20%/19% tariff rates on Brazil/Vietnam/Indonesia coffee imports.
- Ward and Smith LLP, Green Worldwide Logistics, NFFS, and FlavorCloud trade-compliance analyses of the Court of International Trade's Section 122 ruling and the Federal Circuit's stay, checked 3 October 2026 - the 7 May 2026 ruling, the plaintiffs-only relief, the appeal, and the surcharge's 24 July 2026 expiration under its own 150-day statutory cap.
- Federal Reserve, FOMC press conference transcript, 13 October 2025 (reported contemporaneously by Fox Business and MNI; quote matches the Fed's own transcript), checked 3 October 2026 - Powell's 'one-time shift in the price level' quote, used verbatim on screen.
- Federal Reserve, Summary of Economic Projections, 17 September 2025, Table 1, federalreserve.gov/monetarypolicy/fomcprojtabl20250917.htm, fetched in full 3 October 2026 - the median core PCE projections of 3.1% (2025), 2.6% (2026) and 2.1% (2027).
- USDA Economic Research Service, Food Price Outlook, releases through early 2026 (via Grocery Dive, Food Dive, Oklahoma Farm Report reporting), checked 3 October 2026 - the 2.5% food-at-home 2026 forecast and the 27.4% forecast egg-price fall.
- Monitoring Analytics (PJM's Independent Market Monitor), Q1 2026 state-of-the-market report (via Bloomberg Law and SEJ reporting), checked 3 October 2026 - the 75.5% y/y wholesale power cost rise to $136.53/MWh.
- US Energy Information Administration, Short-Term Energy Outlook (December 2025) and retail price data through April 2026, checked 3 October 2026 - the 4.2% 2026 forecast rise and the 7.3% year-on-year rise to April 2026.
- US EIA retail gasoline data and GasBuddy's 2026 forecast (via Rigzone and Hydrocarbon Engineering reporting), checked 3 October 2026 - the $3.10/gallon 2025 average and the sub-$3 2026 forecast.
- Reserve Bank of New Zealand Act 1989 (royal assent 20 December 1989) and RBNZ institutional history - the first legally binding inflation target.
- Bank of Japan policy statements and speeches, 2013-2014, and standard accounts of Japan's 1995-2013 deflation period under Governor Haruhiko Kuroda's 2013 target.
Not regulated financial advice.