
UK economy: GDP, jobs, taxes, the Budget and debt
How the UK economy connects households, businesses, government and investors. GDP, jobs and pay influence taxes and spending; borrowing and gilt markets connect those choices to future costs.
Explains real versus nominal output, labour-market denominators, income tax and National Insurance, VAT, corporation tax and local taxes, Budget choices, deficits, debt and gilt financing. Current figures are dated to 5 October 2026. The 28 October Budget is a future event at this evidence date.
Illustrative calculations are labelled and do not describe a particular household or company. This video provides economic education, not personal tax or investment advice. Sources and photograph credits accompany the package.
Educational documentary. Not financial or investment advice.
In these topics
Chapters
- One economy, four players
- GDP: output rather than wellbeing
- How shocks change the picture
- In work, unemployed or inactive
- Wages, productivity and prices
- Taxes on earnings and purchases
- Business and local taxes
- What the Budget changes
- Deficit is a flow; debt is a stock
- How gilts finance government
- What limits room to spend
Video notes
1. One economy, four players

A household pays for bread. A bakery pays its workers. Both pay taxes. Government pays a nurse, and an investor lends money to government. These sound like separate stories. They are transactions in the same economy, and each payment becomes somebody else's income. Follow those connections and the economic headlines become much easier to read. This video follows an illustrative bakery and the people around it. It explains the UK economy as it stands on the fifth of October, twenty twenty-six.
The household and the bakery exchange work, wages and purchases. Government collects taxes and pays for services, while investors supply borrowed money that carries a future repayment promise.
Our bakery is an example, rather than a report about a particular company. The counter, bread and delivery crates make the connections visible. Its sales depend on customers having money and wanting to spend it. Its workers depend on the business having enough income to pay them. A hospital contract can support its orders; a more expensive loan can make its new oven harder to afford.
A household can save some income instead of spending it immediately. That saving can help finance investment, but it does not guarantee that this bakery receives a loan.
Banks, pension funds and overseas investors connect many such decisions. Imports bring goods into the country; exports bring income from buyers abroad. The UK does not operate inside a sealed box. Energy prices, overseas demand and international interest rates can affect the bakery even when its customers never leave their own town.
An economic headline becomes more useful when we ask what changed and who feels it. More output, more income and a larger tax bill can arrive together, while different households experience very different results.
There is no single dial that answers all these questions. We need a measure of production, a picture of work and pay, and the government's accounts. We also need to know how borrowing connects today's decisions with future costs. Start with the figure that most often stands for the whole economy.
2. GDP: output rather than wellbeing

Gross domestic product, usually shortened to GDP, measures production within the UK over a period. It covers goods and services, including public services. It is a measure of economic output. It does not directly measure happiness, security or how fairly income is shared. Bread trays and flour sacks help explain the accounting before we attach a national growth figure to it.
The farmer supplies wheat, the mill makes flour, and the bakery turns flour into bread. Each stage adds value; counting every sale in full would count the same ingredients repeatedly.
For the bakery, value added is the value of its output less the goods and services it buys for production. That contribution helps pay wages and generate operating income. Statisticians can examine output, expenditure or income to estimate GDP, then reconcile the approaches. Public services need special methods because many are supplied without a market price at the point of use.
Nominal GDP uses the prices paid at the time. Real GDP adjusts for price changes, so a rise in prices alone does not become a rise in measured real output.
GDP per head divides output by the population. It helps distinguish an economy growing through more people from one producing more per person. Even this is an average. It cannot show whether a particular renter, pensioner or low-paid worker has become better off. Unpaid care, environmental damage and access to services also matter to living standards.
Real household disposable income per head rose by one per cent in the second quarter. This is income after taxes and benefits, adjusted for prices and population; it is an average across households.
The national average can rise while some incomes fall. Housing costs, debts and family circumstances change what a given income buys. Growth still matters: more production can create resources for better pay and public services. The next question is what caused that growth, and whether it can last.
3. How shocks change the picture

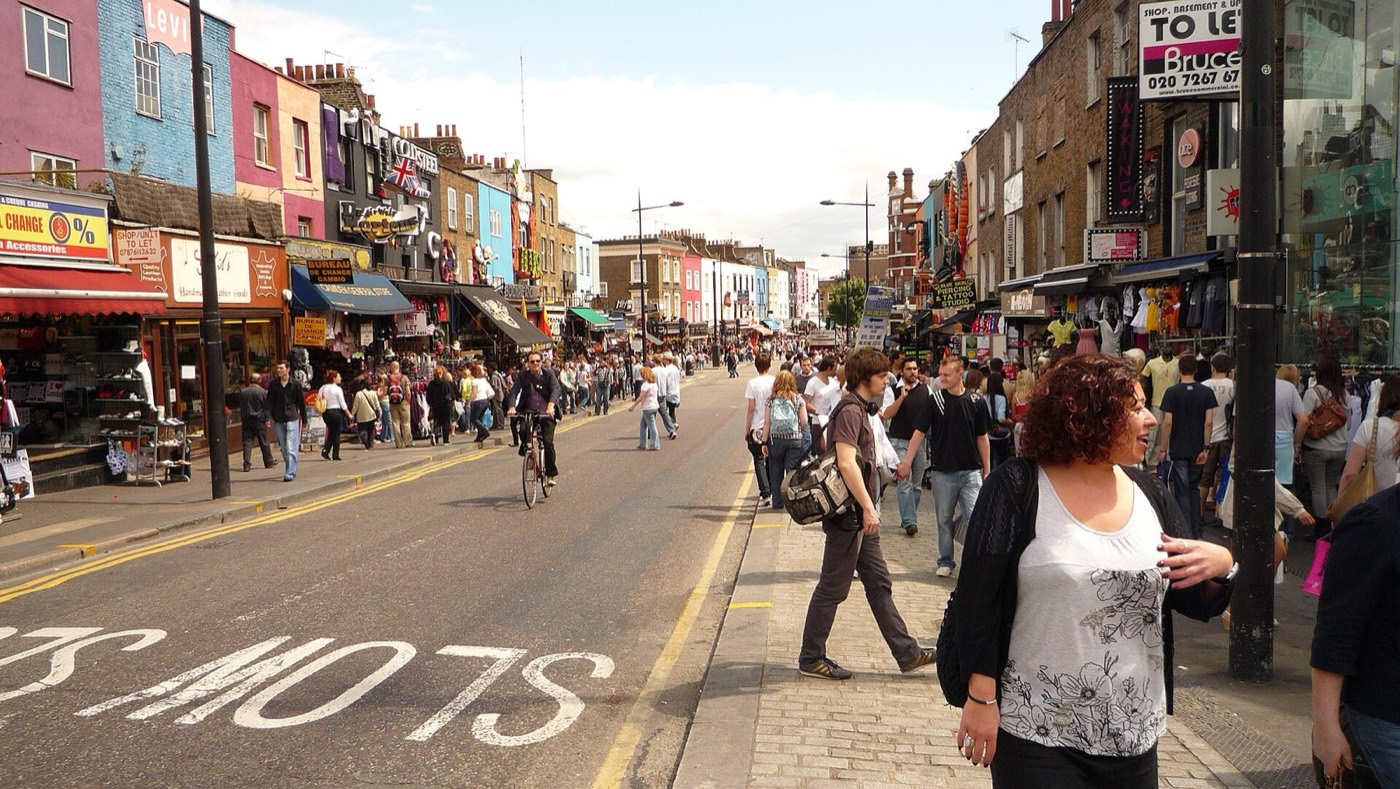
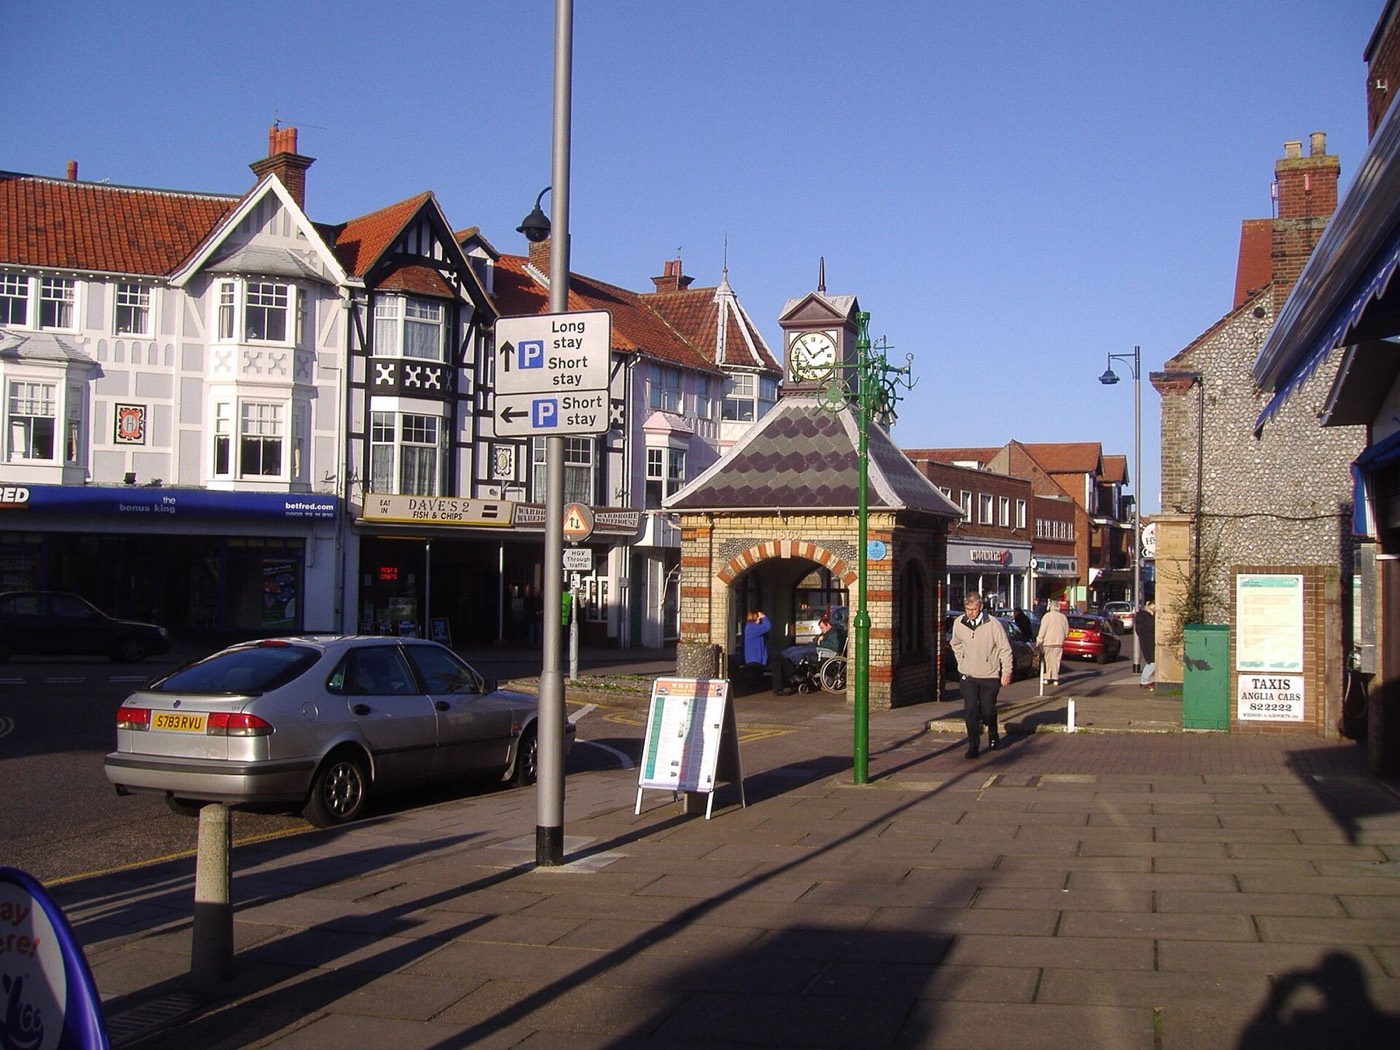

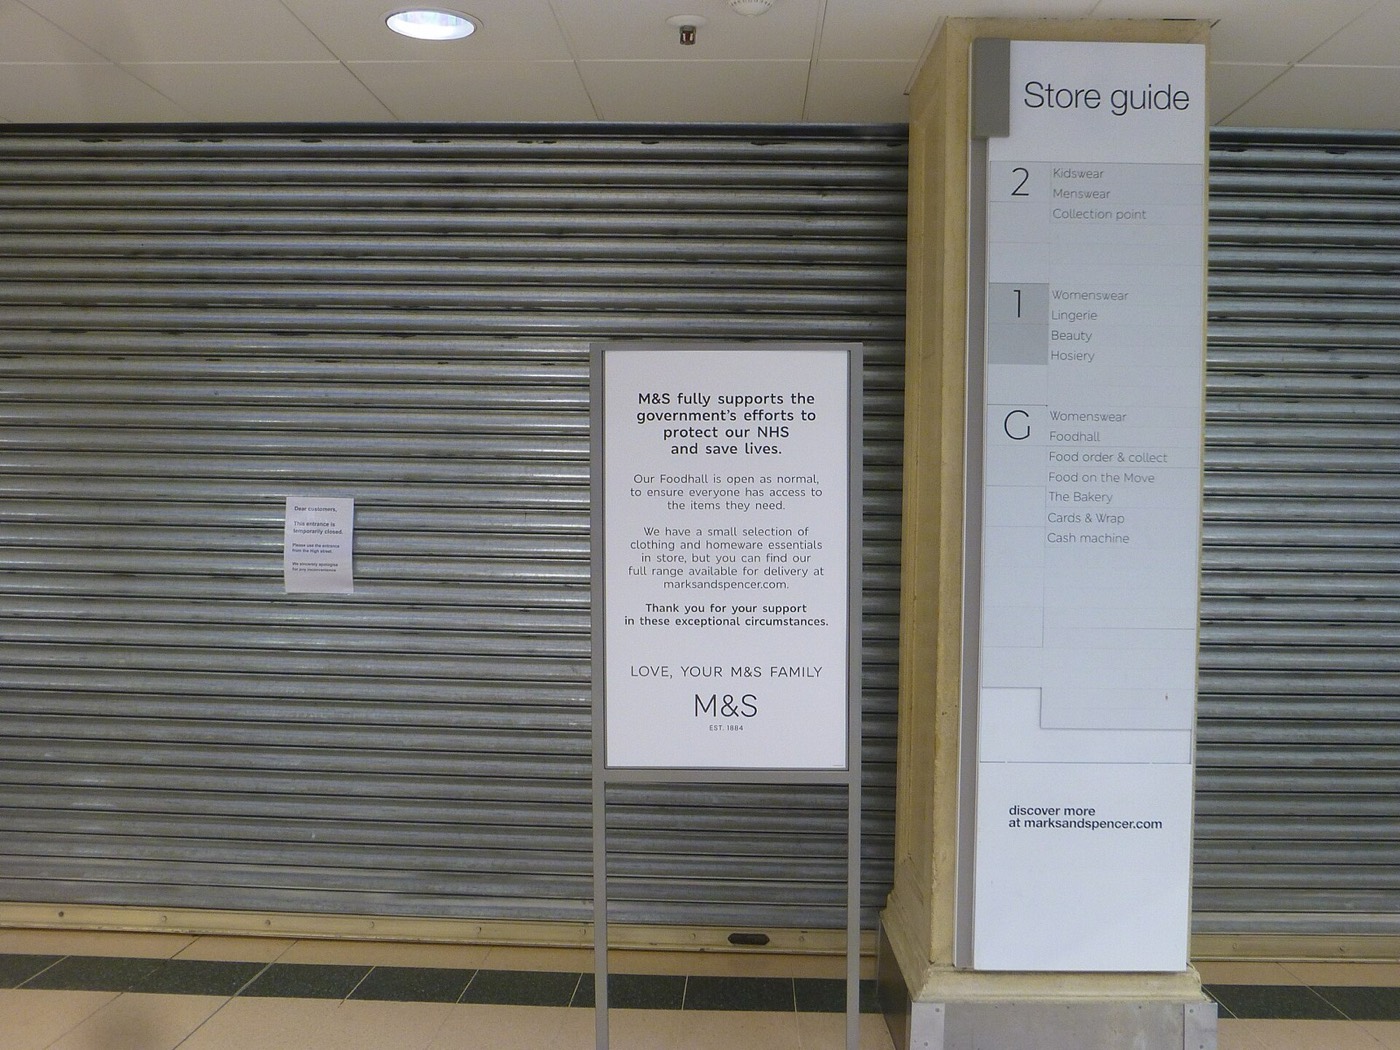
An economy can lose output through very different shocks. A banking crisis can restrict lending and weaken demand. A public-health shutdown can prevent businesses from operating even when customers would like to buy. Recoveries differ because the original damage differs. These dated photographs show settings from those periods; a street photograph is context, not evidence of a national growth rate.
Camden High Street in London appears here in June twenty oh eight. This photograph dates the setting; it cannot tell us which shoppers or businesses were already feeling the financial crisis.
London and Sheringham are the places shown in these archive views. They locate the photographs, rather than representing the whole country or measuring the size of its downturn.
Sheringham town centre in Norfolk appears in January twenty oh eight. A smaller town connects to the same national economy through jobs, visitor spending, bank credit and supply chains.
The financial crisis began in twenty oh eight, and the economy contracted in twenty oh nine. The pandemic shutdown in twenty twenty interrupted activity through a different route; twenty twenty-six belongs to a later recovery period.
The City of London skyline in June twenty oh eight shows the financial district before the autumn crisis intensified. Finance matters beyond that skyline because credit helps households and businesses make payments and invest.
A rise after a fall does not automatically restore the earlier level of output. The starting point matters, and lasting damage to skills, investment or firms can make recovery harder.
A closed London shop in March twenty twenty shows the interruption directly. Restrictions stopped some face-to-face activity, while other work continued or moved online; the effects were uneven across businesses and households.
Real GDP rose by zero point five per cent in the second quarter of twenty twenty-six. The ONS revised its earlier estimate of zero point four per cent after receiving more information; revision is part of measurement.
GDP per head also rose by zero point five per cent in that quarter. The monthly July release reported growth of zero point four per cent from June. Its three-month comparison also gave zero point four per cent, but compared different periods. A monthly move and a rolling three-month move answer different questions. Do not stitch releases from different revision rounds into a supposedly exact historical line.
4. In work, unemployed or inactive

Employment is the bridge between national output and many household incomes. It is also a bridge to taxes and welfare spending. But people without paid work are not all counted as unemployed. Imagine the bakery's workforce and a workshop's apprentices alongside students, carers and people with long-term illness. The categories describe their relationship with paid work, rather than their value to society.
The labour force consists of people in work and people counted as unemployed. People outside that labour force are economically inactive; this is a separate group, rather than another name for unemployment.
A person is counted as unemployed when they have no job, have recently looked for work and are available to start. Someone waiting to start an arranged job can also qualify. An inactive person is neither employed nor unemployed under those definitions. Caring, study, retirement and sickness can all be reasons. Some inactive people want work but cannot currently meet the availability or search conditions.
The employment rate was seventy-five point one per cent among people aged sixteen to sixty-four. The inactivity rate for that same age group was twenty point nine per cent; the figures describe different groups within the same age base.
These rates come from survey estimates, so uncertainty and changes in survey quality matter. Other evidence, including payroll records and vacancies, helps assess the direction of travel. A single small movement is not a complete account of the labour market. Nor does having a job guarantee sufficient hours, secure work or enough income to meet housing costs.
The unemployment rate was four point nine per cent for the labour force aged sixteen and over. Its denominator is people working or seeking available work, so it cannot be added directly to the two working-age rates.
When more people move into paid work, household earnings and tax receipts can rise. Some benefit payments may fall, but many working households also receive support. Better childcare, health and training can affect participation. If vacancies remain unfilled because the available skills do not match, demand alone will not solve the problem. That brings us to what each hour of work produces.
5. Wages, productivity and prices

A pay rise matters through what it buys. Inflation is the rate at which the general price level changes. If pay rises more slowly than prices, purchasing power falls. If pay rises faster, purchasing power improves. A baker loading oven racks can earn more sustainably when better equipment and organisation help the bakery produce more useful output.
Average regular pay grew by three point five per cent from a year earlier. After adjustment using the ONS housing-inclusive inflation measure, real regular pay grew by zero point six per cent over the same period.
Regular pay excludes bonuses. These are averages across employees in Great Britain, rather than a promise about an individual's pay packet. The price adjustment uses the matching period. Subtracting a later month's inflation headline would mix comparisons and produce a misleading answer. A change in the mix of jobs can also affect average earnings.
Productivity means output produced for each unit of input, such as an hour of work. Better tools and organisation can lift output per hour, creating room for higher pay without the same increase in cost per loaf.
Workers do not control every input. Broken equipment, poor transport and weak management can waste their time. Higher productivity can be shared through wages, lower prices or profits, depending on bargaining and competition. A business can also absorb a wage rise through smaller margins, meaning less profit from each sale. There is no mechanical rule that every pay increase becomes inflation.
UK consumer price inflation was three point one per cent in August. The housing-inclusive measure was three point three per cent; both show prices above a year earlier, rather than prices returning to their previous level.
CPI is the Consumer Prices Index. CPIH adds owner-occupiers' housing costs and council tax. Energy shocks can raise production costs; strong demand can let firms increase prices; margins can change too. The Bank of England uses monetary policy, including its policy interest rate, to influence demand and inflation. That can affect mortgages, business loans and government borrowing costs, with delays and unequal effects.
Great Britain covers England, Scotland and Wales, while the United Kingdom also includes Northern Ireland. The pay series here covers Great Britain and the inflation series covers the United Kingdom; keep that geographic distinction when comparing them.
6. Taxes on earnings and purchases


The pay envelope is not the end of the income story. Income tax and employee National Insurance reduce take-home earnings. Purchases can include VAT, a tax on value added collected through registered businesses. We will use the current tax year and a deliberately simple employee example. Actual payslips depend on tax codes, pay periods and personal circumstances.
Dale Street in Manchester provides a present-day commercial setting. This photograph from April twenty twenty-six illustrates the surroundings of business activity; it supplies no evidence about this employee's wages or tax bill.
The standard personal allowance is twelve thousand five hundred and seventy pounds. Outside Scotland, the main rates on earned income are twenty per cent at the basic rate and forty per cent at the higher rate.
The additional rate is forty-five per cent. Rates apply to slices of taxable income, so entering a higher band does not put the whole salary into it. The allowance is reduced for adjusted net income above one hundred thousand pounds. It falls by a pound for every two pounds above that point. That can make the effective marginal rate higher than the headline band.
Our example earns thirty thousand pounds a year and receives the full standard allowance. With no pension or other deductions, income tax is three thousand four hundred and eighty-six pounds under the main non-Scottish rates.
Most employees pay National Insurance at eight per cent in its main band, then two per cent above the upper earnings limit. It is a separate calculation from income tax. Contributions support entitlement to certain benefits and the State Pension, but they are not an individual pension investment account. Our simplified annualised example leaves out differences caused by payroll rounding.
Employee National Insurance in this example is about one thousand three hundred and ninety-four pounds a year. Employer National Insurance is a separate cost, generally fifteen per cent on earnings above five thousand pounds, before applicable reliefs.
The employer charge is not deducted from this employee's gross pay as employee NI. It can still influence hiring, wages and prices because it changes employment costs. VAT's standard rate is twenty per cent; its reduced rate is five per cent. Zero-rated goods have a zero rate, while exemption follows different rules for recovering tax on business purchases. What households can spend depends on both earnings deductions and prices at the counter.
7. Business and local taxes


A company's turnover is the value of its sales. Its taxable profit is worked out after allowable costs and tax adjustments. Those are different measures. A workshop can have busy machinery and high sales while making little profit. Tax on profit therefore reaches a different part of the business from VAT on taxable sales or employer charges on payroll.
Sales provide the starting income for our company. Allowable expenses and tax adjustments lead to taxable profit, and corporation tax applies to that profit rather than charging its headline rate on all turnover.
Investment allowances can change when spending on equipment reduces taxable profit. That matters to the return from a new machine, but a tax incentive cannot ensure that customers will buy the output. A sole trader's business income is usually taxed through personal income tax rules, rather than corporation tax. Legal structure matters before we compare two apparently similar businesses.
The main corporation tax rate is twenty-five per cent. The small profits rate is nineteen per cent, with marginal relief between the relevant thresholds; associated companies can reduce those thresholds.
For a standalone company with a normal full-year accounting period, the usual profit thresholds are fifty thousand pounds and two hundred and fifty thousand pounds. Short periods and company associations require adjustments. Marginal relief smooths the transition between rates. It does not mean a company chooses whichever headline percentage it prefers.
The Cumberland Bar in Edinburgh appears in a photograph from July twenty twenty-six. This street setting introduces jurisdiction differences; it makes no claim about the pub's profits, payroll or local tax bill.
Scotland has its own bands and rates for most earned income, while England and Wales use the main earned-income schedule described earlier. Northern Ireland uses domestic rates for homes; council tax operates in the other nations.
Council tax depends on the property's band, the council's charge and eligibility for discounts or support. Valuation arrangements differ between nations. Northern Ireland's domestic rates use a property's rateable capital value and regional and district rates. Local services also receive funding from other sources. A national tax headline does not tell a household its complete local bill.
8. What the Budget changes

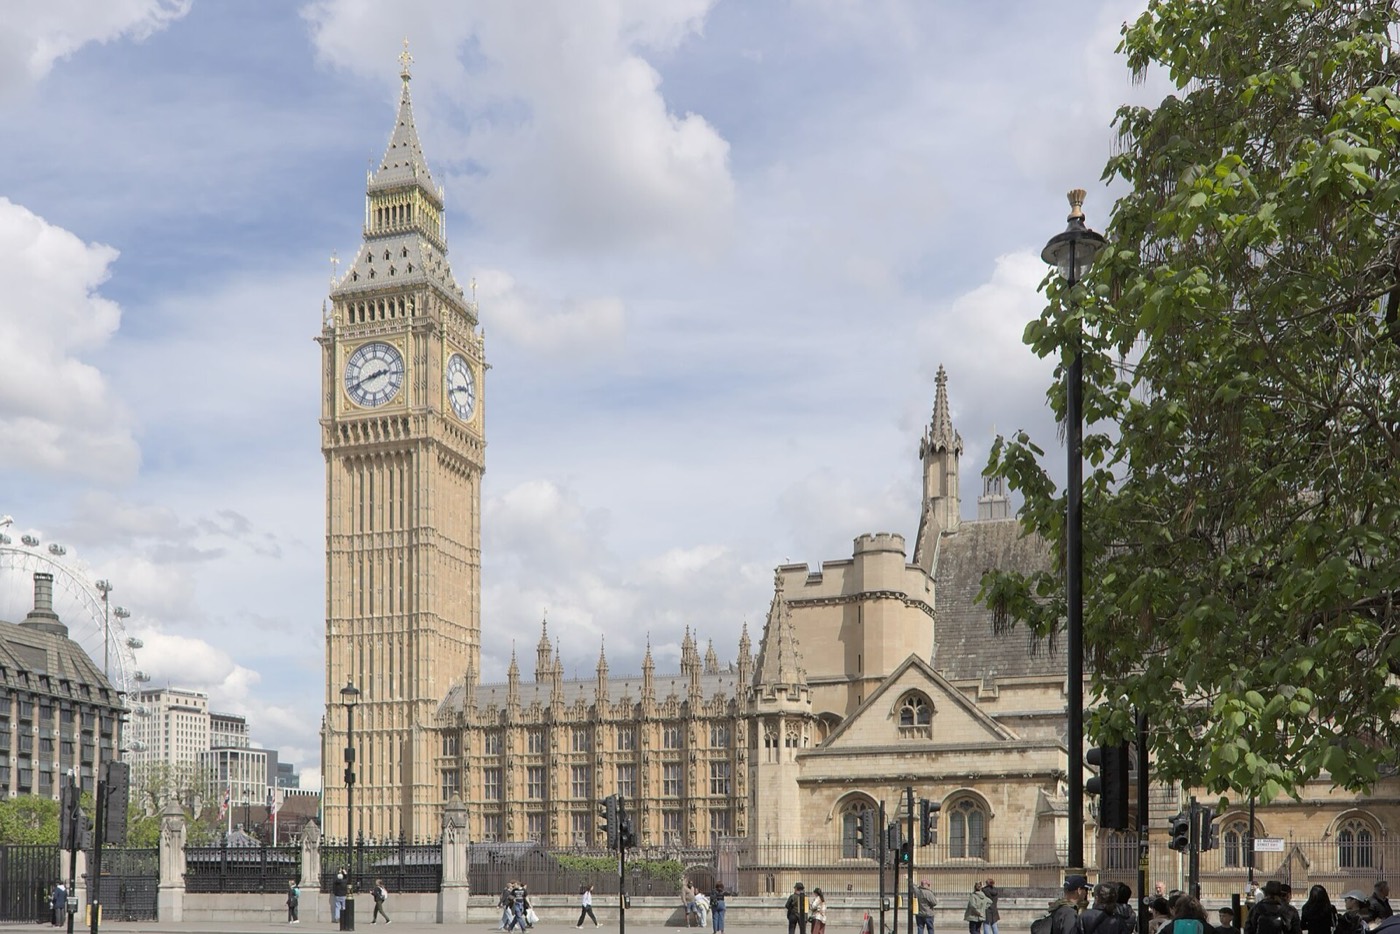
The Chancellor's Budget brings tax, spending and borrowing decisions together. It changes who pays, who receives and when the effects arrive. Budget papers are proposals and forecasts as well as accounts. Parliament authorises taxation and spending through the relevant legislation and procedures. The government chooses policy; the independent Office for Budget Responsibility, or OBR, assesses the outlook and the public finances.
The Palace of Westminster in London is where Parliament scrutinises the government's choices. This photograph from May twenty twenty-six places that scrutiny in its setting; a Budget speech alone does not complete every legal step.
Budget twenty twenty-five announced measures that affect later years, and the OBR updated its outlook in March twenty twenty-six. The next Budget is scheduled for the twenty-eighth of October twenty twenty-six; its decisions are still ahead at this video's evidence date.
A forecast is a conditional estimate, not money already collected. Growth, inflation and interest rates can depart from the assumed path. Policies can also change behaviour, including work, investment and the timing of income. The OBR estimates these effects and the uncertainty around them. A forecast revision can change apparent room for policy even before the Chancellor announces a new measure.
Budget twenty twenty-five announced that personal tax thresholds would remain frozen through April twenty thirty-one. If cash pay rises while thresholds stay fixed, more income can become taxable even without a higher headline tax rate.
For a pensioner, pension uprating and personal tax thresholds interact. For a renter, support and rents affect disposable income. Housing investment can create construction demand now and capacity later, while maintenance and staffing still need funding. For a business, investment allowances, demand and employment costs can pull in different directions. A single label such as tax-cutting Budget cannot describe every household's result.
The Universal Credit two-child limit was removed for assessment periods beginning on or after the sixth of April twenty twenty-six. Eligible larger families can receive more support, but the benefit cap and transitional protection can change the net gain.
That is an implemented change, rather than a prediction about the coming Budget. Spending choices may support incomes and demand, but they also need resources or borrowing. Cutting spending may reduce borrowing directly while weakening activity or service quality. The effects depend on what changes, the economic conditions and the time horizon. To follow them, we must separate a deficit from debt.
9. Deficit is a flow; debt is a stock

A deficit is a gap during a period: spending exceeds income. Debt is an amount outstanding at a point in time. The water tank and tap are an analogy for stock and flow, rather than a literal government balance sheet. A tap can slow while the level still rises. Likewise, borrowing can fall while debt continues to increase.
A deficit adds to financing needs during the year. Debt is the outstanding stock, and repayments, cash holdings and other financial transactions also affect how that stock changes.
Public sector net borrowing is the main headline measure of the deficit. The current budget balance looks at current receipts against current spending, including depreciation. Investment is treated separately, so balancing the current budget does not mean total borrowing is zero. Buildings and infrastructure can improve future services and output, but they cost money now and carry execution risks.
Public sector borrowing was seventy-seven point three billion pounds in the financial year to August. That was eight point one billion pounds above the OBR forecast for the same period; the figure excludes public sector banks.
August alone accounted for eighteen point three billion pounds. Monthly receipts and spending vary with payment schedules and economic conditions, so multiplying one month by the number of months in a year is not a sound annual forecast. The estimates are provisional and revised as better information arrives. Borrowing measures and cash requirements also differ because accounting records some transactions before cash changes hands.
Public sector net debt was about two point nine nine trillion pounds at the end of August. It was equivalent to ninety-three point eight per cent of GDP; these are two ways of expressing the same headline measure.
Net debt subtracts liquid financial assets from the relevant liabilities. A wider measure, net financial liabilities, includes more financial assets and obligations. Its GDP share was eighty-two point three per cent, so the two ratios must not be swapped. Neither measure simply subtracts every public building from debt. Asset purchases, sales and valuation effects explain why a change in debt need not equal the reported deficit.
10. How gilts finance government

Government borrowing often uses gilts, which are UK government bonds. A bond is a promise to make specified payments and repay principal, the original amount borrowed, at maturity. Maturity means the repayment date. A bond certificate represents that promise here, although modern ownership is recorded electronically. Investors include pension funds, insurers, banks and overseas institutions.
The Debt Management Office sells gilts through auctions and other methods to raise money for government. Investors receive the promised payments and repayment at maturity, while existing gilts can change hands between investors.
Conventional gilts fix their coupon, meaning the scheduled interest payment, when issued. Their market price can still move. Yield means the return implied by the price and promised payments. When the price falls, the yield rises, other things equal. That relationship does not alter the fixed coupon of an existing conventional gilt. It changes what buying it now offers the next investor.
Higher market yields feed into the cost of new borrowing and replacing debt as it matures. The interest bill does not instantly reprice every existing fixed-coupon gilt, because those earlier payment promises remain in place.
Index-linked gilts work differently: their principal and interest payments are linked to the Retail Prices Index, or RPI, with a lag. RPI is not the CPI headline discussed earlier. Treasury bills provide short-term borrowing, and National Savings and Investments raises money through savings products. The annual financing programme covers cash needs and maturing debt, so gilt sales are not simply the deficit total.
Central government debt interest payable reached fifty billion pounds from April to August. August's interest included a two point one billion pound uplift on index-linked gilts; accrued indexation need not be cash paid out in that month.
August's total interest payable was eight point eight billion pounds. Yields reflect expected policy rates, inflation, international bond markets, supply and risk. They are not a simple score for one politician. Investors may require a different return when any of those conditions changes. Market functioning matters as well as the level of yields.
On the twenty-eighth of September twenty twenty-two, the Bank of England began temporary gilt purchases to address market dysfunction. That intervention was a financial-stability operation; it does not describe the normal financing programme in twenty twenty-six.
Some pension strategies used borrowing and derivatives to manage their future payment obligations. They are known as liability-driven investment. Sharp market moves created demands for collateral, meaning assets pledged to support positions. Forced gilt sales could amplify the moves. That mechanism interacted with changing UK and global conditions; it is not evidence that one factor explains every change in yields.
11. What limits room to spend

Return to the household, bakery, government and investor. A growth headline can change tax receipts. A jobs headline can change wages and welfare needs. A Budget can change borrowing, and a market move can change interest costs. The hospital supplies and trolley remind us what is at stake: staff, services and real resources, alongside the money that pays for them.
Stronger activity can increase taxable earnings, spending and profits. Those receipts can improve the public finances, but the result depends on the kind of growth, the tax rules and what government spends alongside it.
More employment can improve household incomes and reduce some welfare needs. Better health and childcare can make employment possible, while reliable transport can make businesses more productive. The chain can therefore run in both directions. Treating spending only as a cost misses possible benefits; treating every spending promise as self-financing misses uncertainty and the need to deliver.
Debt sustainability depends partly on borrowing costs relative to nominal economic growth. It also depends on the primary balance, meaning receipts minus spending before interest, and on how quickly debt needs refinancing.
If nominal GDP rises, the debt ratio can fall even while the cash debt total rises. But inflation that enlarges nominal GDP can also increase indexed debt costs and demands for higher public-sector pay. A favourable denominator is not a free lunch. Faster real growth is usually more helpful because it can expand the goods and services available to meet competing claims.
There is no universal debt percentage that guarantees safety for every country. Credibility, currency, maturity, institutions and exposure to shocks matter alongside the debt stock; forecasts must therefore be read as paths with risks.
Fiscal rules are the government's chosen tests for borrowing and debt, assessed using particular definitions and forecast years. Headroom means the forecast margin against those tests. A small margin can disappear when growth or interest-rate assumptions change. Passing a rule does not settle whether services are good enough, whether taxes are fair or whether investment delivers value.
The next Budget is scheduled for the twenty-eighth of October. At the fifth of October, its measures are not yet announced here; the useful test is how each choice changes incomes, production, receipts, borrowing and future costs.
Ask whether a headline is a level or a rate of change. Ask which people and period it covers. Ask whether it is an observation, a forecast or an illustrative example. Then follow the connections. Growth matters through jobs and resources. Taxes and spending distribute those resources and influence demand. Borrowing spreads payments across time, with interest and risks attached. The economy makes more sense when we read those stories together.
Sources and credits
Photo credits (Wikimedia Commons)
- Camden High Street, London — 29 June 2008; dated archive background: Soupspoon, Public domain - https://commons.wikimedia.org/wiki/File%3ACamden_High_Street_June_2008.jpg
- Sheringham town centre, Norfolk — 24 January 2008; dated UK high-street archive: Stavros1 at English Wikipedia, Public domain - https://commons.wikimedia.org/wiki/File%3ASheringham_24th_Jan_2008_%281%29.JPG
- City of London: Lloyd’s, Willis Building and 30 St Mary Axe — 26 June 2008; dated archive background: Syced, CC0 - https://commons.wikimedia.org/wiki/File%3AJune_2008_London_3.jpg
- Closed London shop during COVID-19 lockdown — 31 March 2020: citytransportinfo, CC0 - https://commons.wikimedia.org/wiki/File%3ALockdown-Closure-P1630492_%2850007743288%29.jpg
- 24–28 Dale Street, Manchester, England — 16 April 2026; illustrative commercial street background: Mmberney, CC0 - https://commons.wikimedia.org/wiki/File%3A24-28_Dale_Street%2C_Manchester%2C_April_2026.jpg
- Cumberland Bar and adjoining pavement, Edinburgh, Scotland — 30 July 2026; illustrative street background: GanzKnusper, CC0 - https://commons.wikimedia.org/wiki/File%3ACumberland_Bar_%28side_view%29%2C_pub_in_Edinburgh%2C_July_2026.jpg
- Palace of Westminster, London — 17 May 2026: Aethonatic, CC0 - https://commons.wikimedia.org/wiki/File%3APalace_of_Westminster_-_17_May_2026.jpg


Primary sources
- S1: ONS. GDP quarterly national accounts, UK: April to June 2026. 30 September 2026. https://www.ons.gov.uk/economy/grossdomesticproductgdp/bulletins/quarterlynationalaccounts/apriltojune2026.
- S2: ONS. GDP monthly estimate, UK: July 2026. 11 September 2026. https://www.ons.gov.uk/economy/grossdomesticproductgdp/bulletins/gdpmonthlyestimateuk/july2026.
- S3: ONS. Labour market overview, UK: September 2026. 15 September 2026. https://www.ons.gov.uk/employmentandlabourmarket/peopleinwork/employmentandemployeetypes/bulletins/uklabourmarket/september2026.
- S4: ONS. Consumer price inflation, UK: August 2026. 16 September 2026. https://www.ons.gov.uk/economy/inflationandpriceindices/bulletins/consumerpriceinflation/august2026.
- S5: ONS. Public sector finances, UK: August 2026. 22 September 2026. https://www.ons.gov.uk/economy/governmentpublicsectorandtaxes/publicsectorfinance/bulletins/publicsectorfinances/august2026.
- S6: HM Treasury. Budget 2025, sections 5.2 and 5.3. 26 November 2025. https://www.gov.uk/government/publications/budget-2025-document/budget-2025-html.
- S7: HM Treasury. Chancellor letter to TSC: Budget 2026 date. 31 July 2026. https://www.gov.uk/government/publications/chancellor-letter-to-the-treasury-select-committee-tsc-budget-2026-date.
- S8: HMRC. Income Tax rates and Personal Allowances. 2026/27; checked 5 October 2026. https://www.gov.uk/income-tax-rates.
- S9: HMRC. National Insurance: how much you pay. 2026/27; checked 5 October 2026. https://www.gov.uk/national-insurance/how-much-you-pay.
- S10: HMRC. Rates and thresholds for employers 2026 to 2027. 2026/27; checked 5 October 2026. https://www.gov.uk/guidance/rates-and-thresholds-for-employers-2026-to-2027.
- S11: HMRC. VAT rates. checked 5 October 2026; standard rate since 4 January 2011. https://www.gov.uk/vat-rates.
- S12: HMRC. Corporation Tax rates and allowances. 2026; checked 5 October 2026. https://www.gov.uk/government/publications/rates-and-allowances-corporation-tax/rates-and-allowances-corporation-tax.
- S13: GOV.UK. How Council Tax works. checked 5 October 2026. https://www.gov.uk/council-tax.
- S14: UK Debt Management Office. About gilts. undated guidance; checked 5 October 2026. https://dmo.gov.uk/responsibilities/gilt-market/about-gilts/.
- S15: HM Treasury / DMO. Debt management report 2026-27. March 2026. https://www.dmo.gov.uk/media/0uuiqi10/drmr2627.pdf.
- S16: Bank of England. Bank of England announces gilt market operation. 28 September 2022. https://www.bankofengland.co.uk/news/2022/september/bank-of-england-announces-gilt-market-operation.
- S17: ONS. Coronavirus and the impact on output: December 2020. 12 February 2021. https://www.ons.gov.uk/economy/grossdomesticproductgdp/articles/coronavirusandtheimpactonoutputintheukeconomy/december2020.
- S18: OBR. Economic and fiscal outlook, March 2026. 3 March 2026. https://www.gov.uk/government/publications/march-2026-economic-and-fiscal-outlook.
- S19: ONS, What is GDP and how do we calculate it?. undated guidance; checked 5 October 2026. https://www.ons.gov.uk/aboutus/usingpublicdatatoproducestatistics/learningaboutdata/learnmoreaboutwhoweareandwhatwedo/whatisgdpandhowdowecalculateit.
- S20: ONS, Employment in the UK: September 2026. 15 September 2026. https://www.ons.gov.uk/employmentandlabourmarket/peopleinwork/employmentandemployeetypes/bulletins/employmentintheuk/september2026.
- S21: DWP, Universal Credit claimants statistics on the two child limit policy, April 2026. July 2026 release; checked 5 October 2026. https://www.gov.uk/government/statistics/universal-credit-claimants-statistics-on-the-two-child-limit-policy-april-2026/universal-credit-claimants-statistics-on-the-two-child-limit-policy-april-2026.
- S22: ONS, Average weekly earnings in Great Britain: September 2026. 15 September 2026. https://www.ons.gov.uk/employmentandlabourmarket/peopleinwork/employmentandemployeetypes/bulletins/averageweeklyearningsingreatbritain/september2026.
- S23: HMRC, Rates and allowances: National Insurance contributions. 2026/27 table; checked 5 October 2026. https://www.gov.uk/government/publications/rates-and-allowances-national-insurance-contributions/rates-and-allowances-national-insurance-contributions.
- S24: HMRC, Corporation Tax rates, expenses and reliefs. current guidance; checked 5 October 2026. https://www.gov.uk/corporation-tax-rates.
- S25: HMRC, Claim capital allowances. current guidance; checked 5 October 2026. https://www.gov.uk/capital-allowances.
- S26: HMRC, Income Tax in Scotland. 2026/27 table; checked 5 October 2026. https://www.gov.uk/scottish-income-tax.
- S27: nidirect, How rate bills are calculated. undated current guidance; checked 5 October 2026. https://www.nidirect.gov.uk/articles/how-rate-bills-are-calculated.
- S28: Bank of England, Financial Stability Report, December 2022. 13 December 2022; checked 5 October 2026. https://www.bankofengland.co.uk/financial-stability-report/2022/december-2022.
Not regulated financial advice.